

Question: solve as soon as possible Q.3) Consider a frequency distribution table for the sampled data as shown in the figure. Class limits Class boundaries Mid
solve as soon as possible
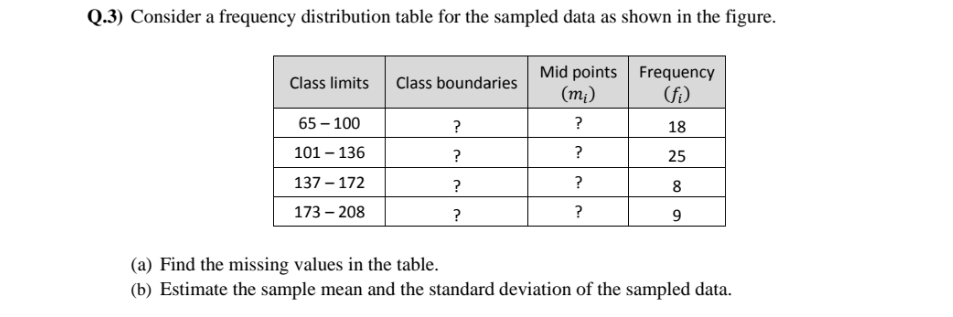
Q.3) Consider a frequency distribution table for the sampled data as shown in the figure. Class limits Class boundaries Mid points Frequency (mi) (fi ) 65- 100 ? ? 18 101 -136 ? 25 137 - 172 ? 8 173 - 208 9 (a) Find the missing values in the table. (b) Estimate the sample mean and the standard deviation of the sampled data
Step by Step Solution
There are 3 Steps involved in it
1 Expert Approved Answer
Step: 1 Unlock

Question Has Been Solved by an Expert!
Get step-by-step solutions from verified subject matter experts
Step: 2 Unlock
Step: 3 Unlock