

Question: Solve both pages show work 6.1 MODELLING RELATIONSHIPS: LINEAR CORRELATION OF BIVARIATE DATA biologist is studying the relationship between height above sea level and the
Solve both pages show work
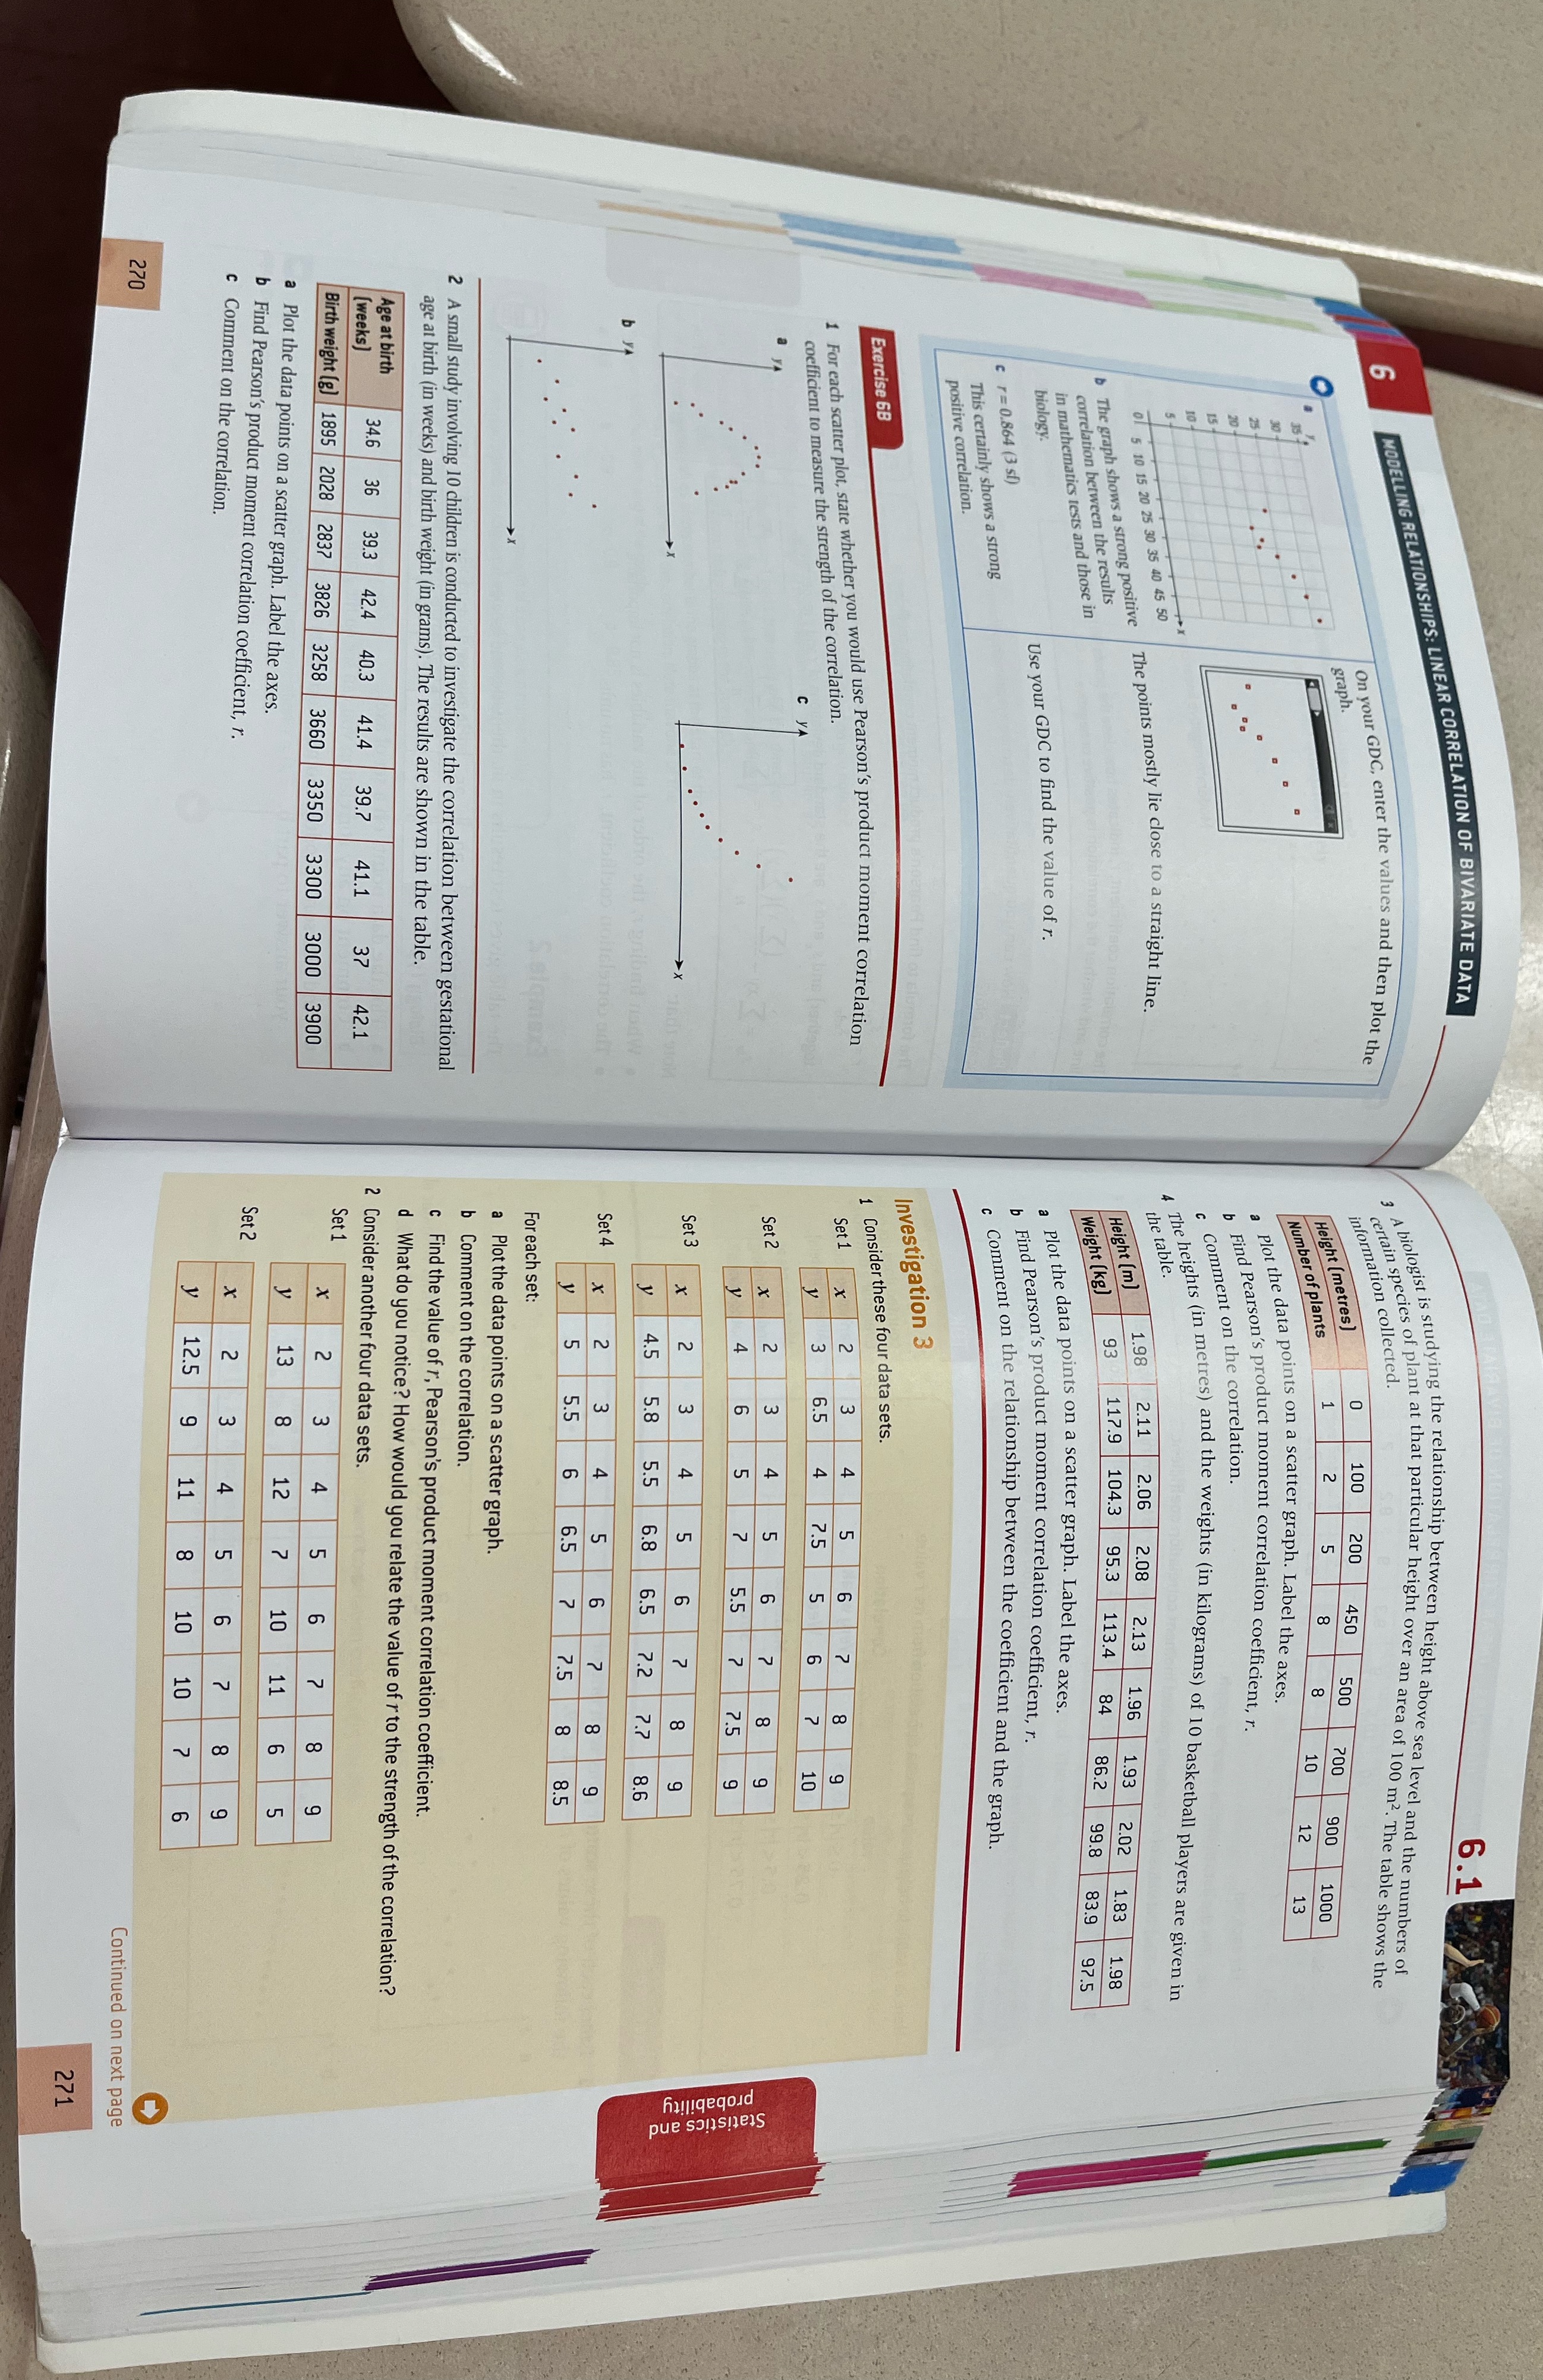
6.1 MODELLING RELATIONSHIPS: LINEAR CORRELATION OF BIVARIATE DATA biologist is studying the relationship between height above sea level and the numbers of A in species of plant at that particular height over an area of 100 m2. The table shows the On your GDC, enter the values and then plot the information collected . raph. Height ( metres ] 2 100 200 450 500 700 900 1000 5 8 8 Number of plants 10 12 13 plot the data points on a scatter graph. Label the axes. b Find Pearson's product moment correlation coefficient , r . c Comment on the correlation . The heights (in metres) and the weights (in kilograms) of 10 basketball players are given in 4 The the table . 0 5 10 15 20 25 30 35 40 45 50 The graph shows a strong positive The points mostly lie close to a straight line. Height (m) 1.98 2.11 2.06 2.08 2.13 1.96 1.93 2.02 1.83 1.98 Weight (kg] 93 117.9 104.3 95.3 113.4 84 86.2 99.8 83.9 97.5 correlation between the results in mathematics tests and those in a Plot the data points on a scatter graph. Label the axes. biology. Use your GDC to find the value of r. b Find Pearson's product moment correlation coefficient , r . c r= 0.864 (3 51) c Comment on the relationship between the coefficient and the graph. This certainly shows a strong positive correlation. Investigation 3 Exercise 68 1 Consider these four data sets. For each scatter plot, state whether you would use Pearson's product moment correlation Set 1 x 2 + m 6.5 75 6 ? 5 8 7 coefficient to measure the strength of the correlation. 1 3 6 Set 2 4 5 6 00 4 7 5.5 ? 7.5 probability Statistics and Set 3 2 3 4 5 6 ? 8 4.5 5.8 5.5 6.8 6.5 7.2 7.7 8.6 by Set 4 * 3 4 ? 5 5.5 6 6.5 7.5 For each set : a Plot the data points on a scatter graph b Comment on the correlation. 2 A small study involving 10 children is conducted to investigate the correlation between gestational c Find the value of r, Pearson's product moment correlation coefficient. age at birth (in weeks) and birth weight (in grams). The results are shown in the table. d What do you notice? How would you relate the value of r to the strength of the correlation? Age at birth 34.6 36 39 .3 42.4 40.3 2 Consider another four data sets. 41.4 2.1 [weeks) 39.7 41.1 Set 1 m N X + LO LO Birth weight (g) 1895 2028 2837 3826 3258 3660 3350 3300 3000 3900 CO 2 a Plot the data points on a scatter graph. Label the axes. b Find Pearson's product moment correlation coefficient, r. Set 2 c Comment on the correlation. 12.5 Continued on next page 270 271
Step by Step Solution
There are 3 Steps involved in it

Get step-by-step solutions from verified subject matter experts