

Question: solve by hand and not excel please Q3: Given the following inputs: begin{tabular}{c|c} Interest rate & 6.25 Dividend rate & 6.00 end{tabular} and the
solve by hand and not excel please
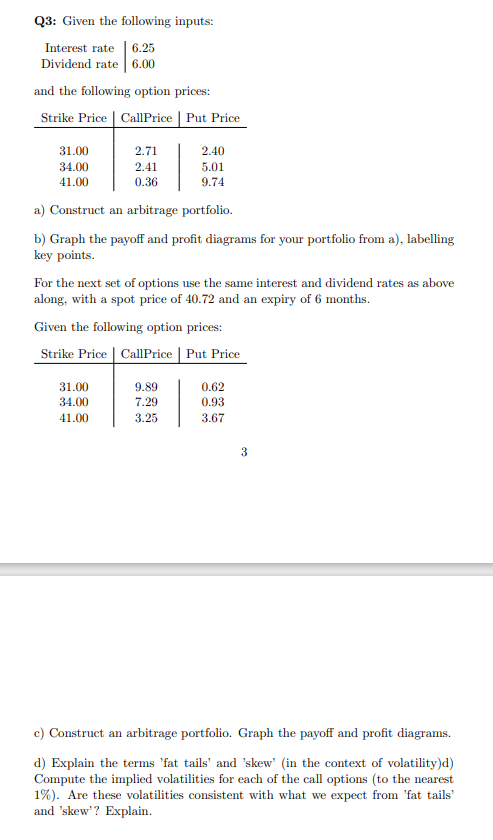
Q3: Given the following inputs: \begin{tabular}{c|c} Interest rate & 6.25 \\ Dividend rate & 6.00 \end{tabular} and the following option prices: a) Construct an arbitrage portfolio. b) Graph the payoff and profit diagrams for your portfolio from a), labelling key points. For the next set of options use the same interest and dividend rates as above along, with a spot price of 40.72 and an expiry of 6 months. Given the following option prices: c) Construct an arbitrage portfolio. Graph the payoff and profit diagrams. d) Explain the terms 'fat tails' and 'skew' (in the context of volatility)d) Compute the implied volatilities for each of the call options (to the nearest 1%). Are these volatilities consistent with what we expect from 'fat tails' and 'skew'? Explain
Step by Step Solution
There are 3 Steps involved in it

Get step-by-step solutions from verified subject matter experts