

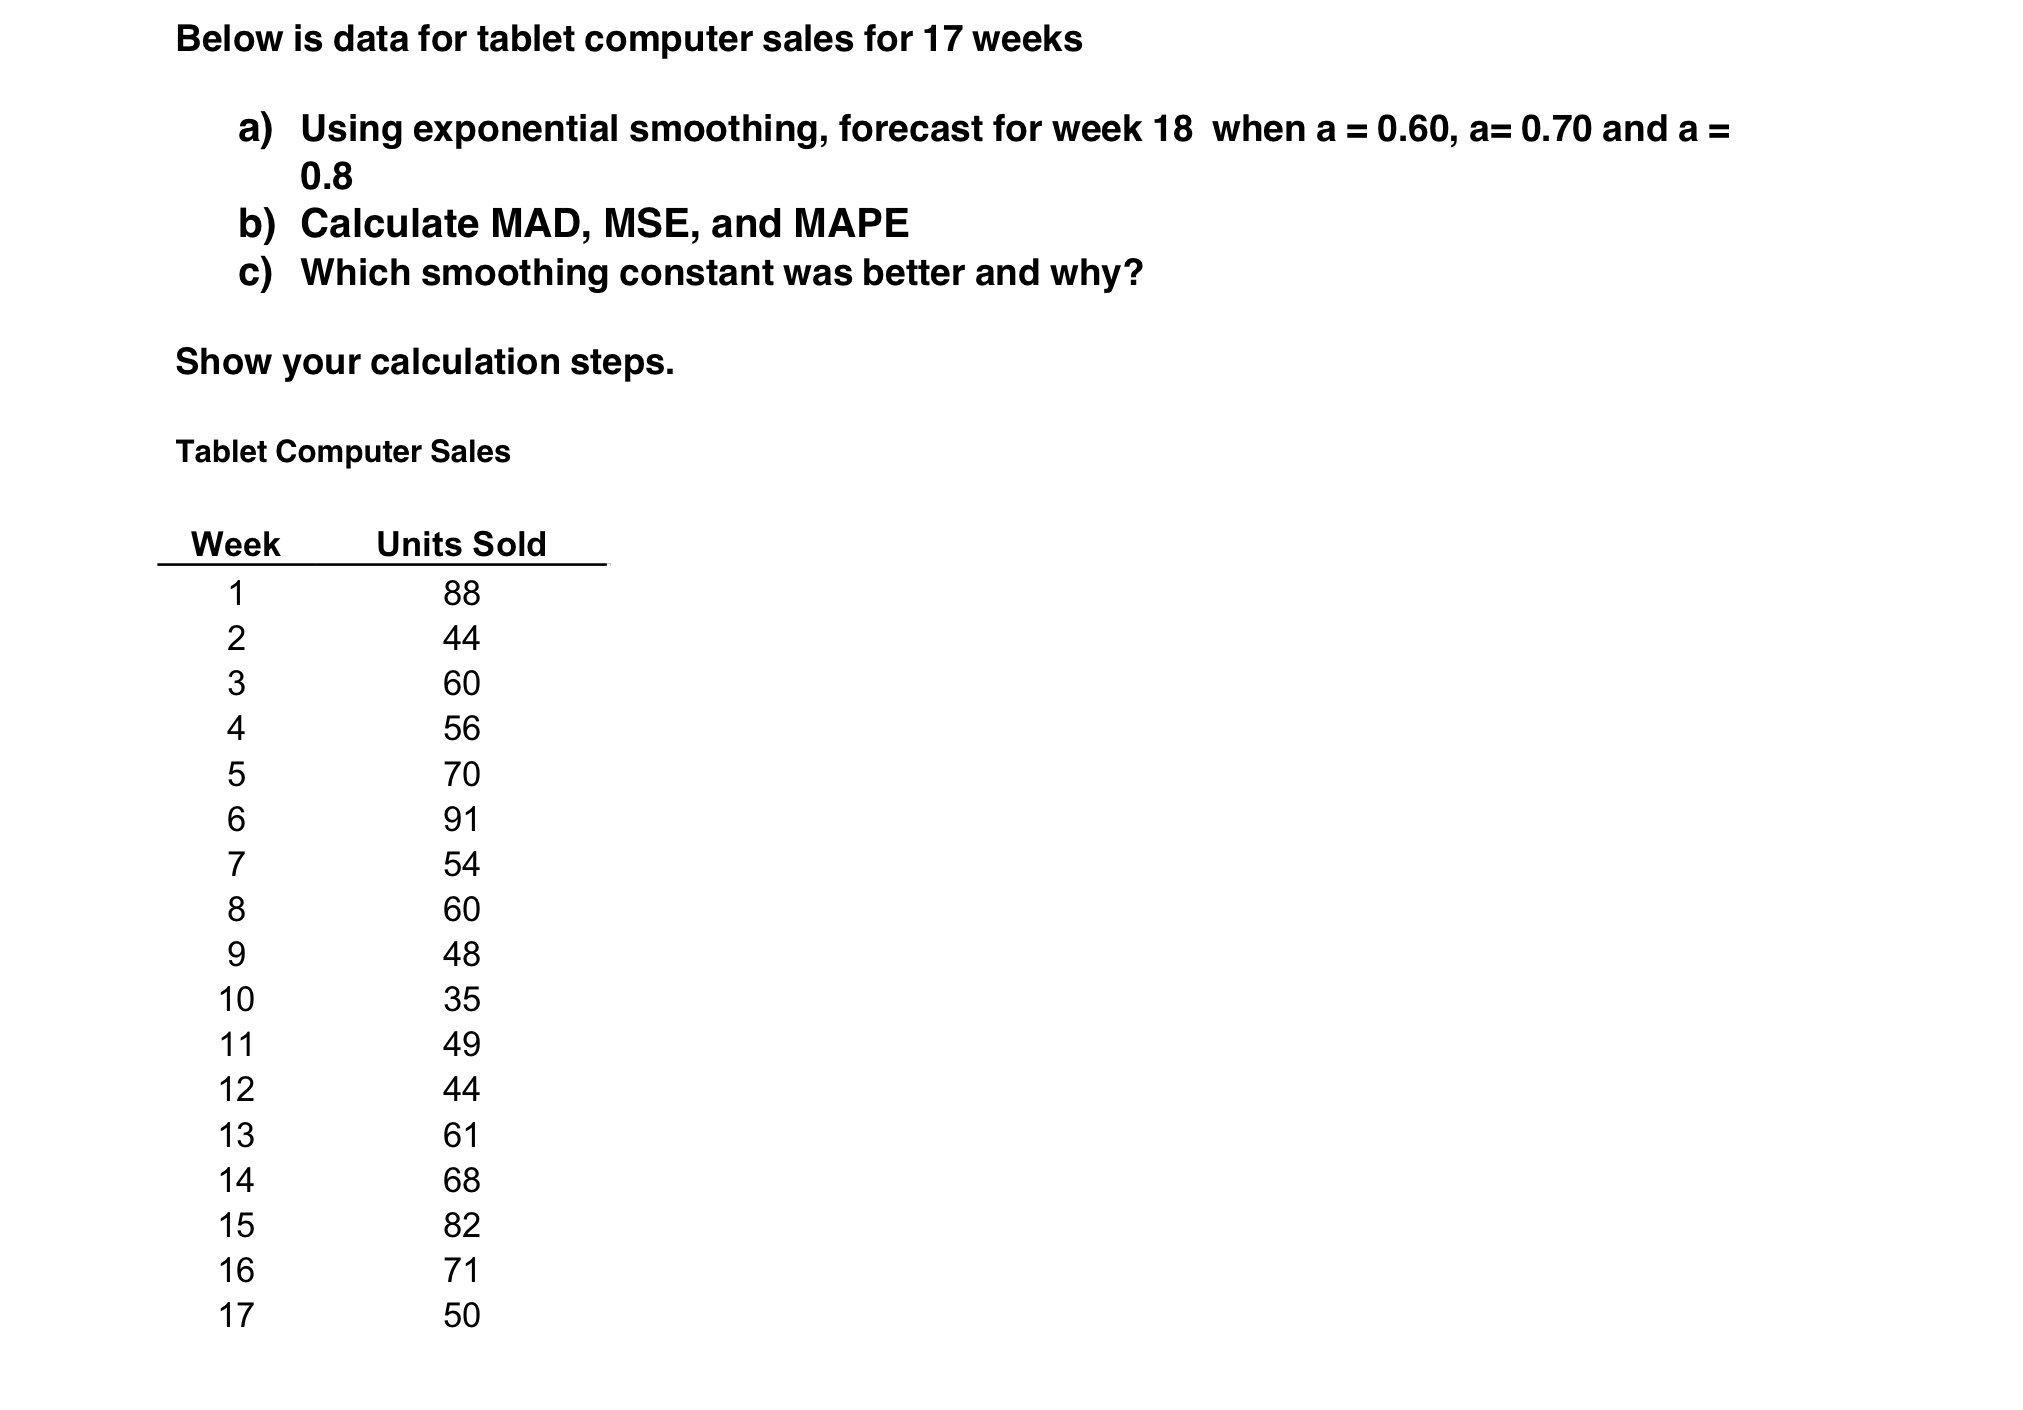
Question: SOLVE BY HAND PLEASE ( not excel ) Below is data for tablet computer sales for 1 7 weeks a ) Using exponential smoothing, forecast
SOLVE BY HAND PLEASE not excel
Below is data for tablet computer sales for weeks
a Using exponential smoothing, forecast for week when and
b Calculate MAD, MSE, and MAPE
c Which smoothing constant was better and why?
Show your calculation steps.
Tablet Computer Sales
tableWeekUnits Sold
Step by Step Solution
There are 3 Steps involved in it
1 Expert Approved Answer
Step: 1 Unlock

Question Has Been Solved by an Expert!
Get step-by-step solutions from verified subject matter experts
Step: 2 Unlock
Step: 3 Unlock