

Question: Solve by the Graphical Method and then verify with ExcelSolver. Identify the feasible region, optimal point on the plot, and optimal quantity of A and
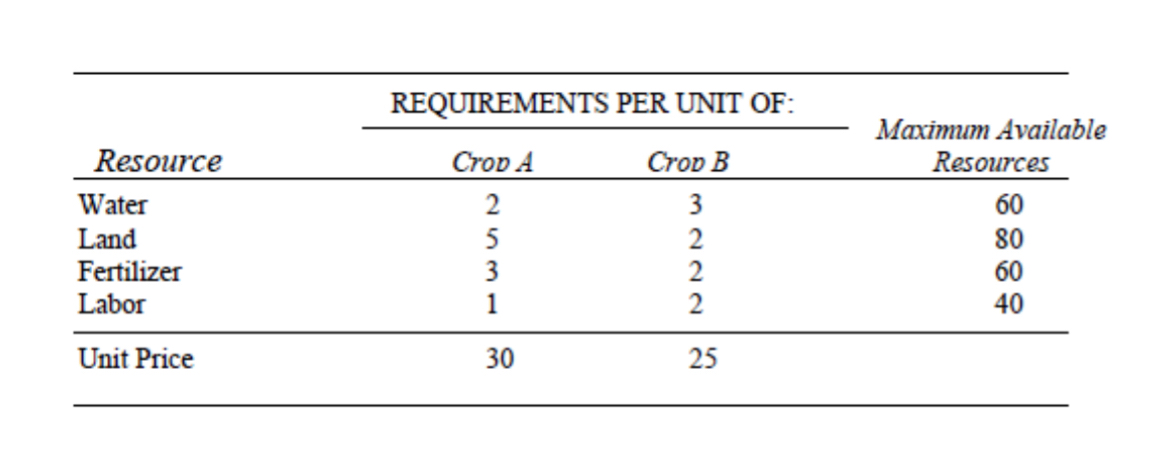
Solve by the Graphical Method and then verify with ExcelSolver. Identify the feasible region, optimal point on the plot, and optimal quantity of A and BTwo types of crops can be grown in a particular irrigated area each year. Each unit quantity of crop A can be sold for a price PA and requires WA units of water,LA units of land,FA units of fertilizer,and HA units of labor. Similarly, crop B can be sold at a unit price of PB and requires WBLBFB and HB units of water,land,fertilizer,and labor,respectively,per unit of crop. Assume that the available quantities of water, land, fertilizer, and labor are known, and equal WLFand Hrespectively.See Table for all
tableREQUIREMENTS PER UNIT OF:ResourceCroD Crov tableMaximum AvailableResourcesWaterLandFertilizerLaborUnit Price,values
Step by Step Solution
There are 3 Steps involved in it
1 Expert Approved Answer
Step: 1 Unlock

Question Has Been Solved by an Expert!
Get step-by-step solutions from verified subject matter experts
Step: 2 Unlock
Step: 3 Unlock