

Question: SOLVE EXERCISE 14.1 PLEASE. please show code as well as tables using matlab 14 Elementwise Examples Exercise 14.1 Tabulate the functions Example 14.1 Draw graphs
SOLVE EXERCISE 14.1 PLEASE. please show code as well as tables using matlab
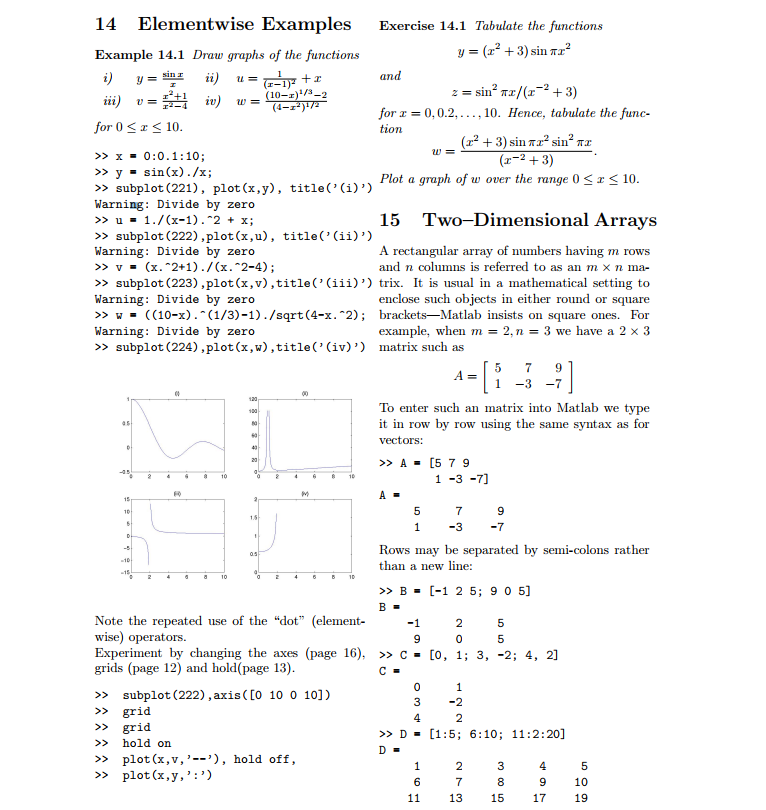
14 Elementwise Examples Exercise 14.1 Tabulate the functions Example 14.1 Draw graphs of the functions y = (12 + 3) sin and z = sin,z/(z-2 + 3) for z 0,0.2,..., 10. Hence, tabulate the func- 0-r/3 tv for 0 ss 10 (12 + 3) sin 12 sin2 1 Plot a graph of w over the range 0 Sr 10 15 Two-Dimensional Arrays A rectangular array of numbers having m rows >>subplot (221), plot(x,y), title'(i)') Warning: Divide by zero >>subplot (222),plot(x,u), title('(ii)') Warning: Divide by zero and n columns is referred to as an m n ma- enclose such objects in either round or square example, when m-2, n-3 we have a 2 3 >>subplot (223),plot(x,v),title('(iii)') trix. It is usual in a mathematical setting to Warning: Divide by zero -C(10-x).(1/3)-1)./sqrt (4-x.~2); brackets-Matlab insists on square ones. For Warning: Divide by zero >>subplot (224),plot(x,w),title('(iv)') matrix such as To enter such an matrix into Matlab we type it in row by row using the same syntax as for >>A[5 7 9 9 1 -37 Rows may be separated by semi-colons rather than a new line: d 10 8 10 >>B-[-1 2 5; 9 0 5] Note the repeated use of the "dot" (element-1 25 wise) operators. Experiment by changing the axes (page 16), >> c [o, 1; 3, -2; 4, 2] grids (page 12) and hold (page 13) 5 >> subplot (222),axis([0 10 0 10]) >> grid >> grid >> hold on >plot (x,v, '--), hold off, >plot(x,y,':') 3 8 11 13 15 17 19 9 10
Step by Step Solution
There are 3 Steps involved in it

Get step-by-step solutions from verified subject matter experts