

Question: Solve for the optimum aggregate plan. The solution must be compatible with excel, so show calculations please. Make sure all steps on the bottom are
Solve for the optimum aggregate plan. The solution must be compatible with excel, so show calculations please. Make sure all steps on the bottom are accounted for in the aggregate plan.
FYI, the answer is between $ and $
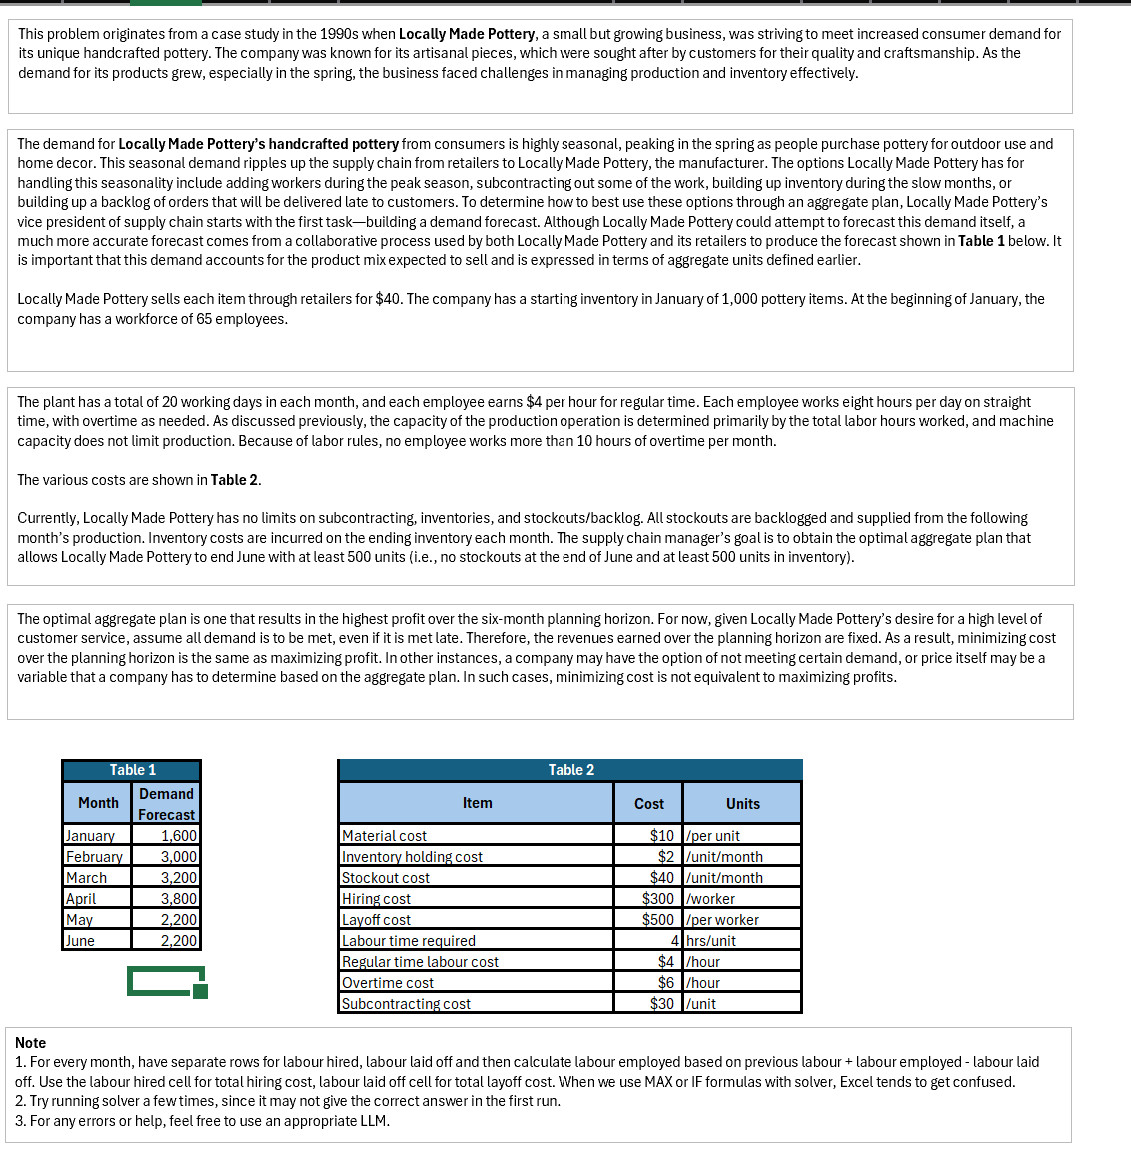
This problem originates from a case study in the s when Locally Made Pottery, a small but growing business, was striving to meet increased consumer demand for its unique handcrafted pottery. The company was known for its artisanal pieces, which were sought after by customers for their quality and craftsmanship. As the demand for its products grew, especially in the spring, the business faced challenges in managing production and inventory effectively.
The demand for Locally Made Pottery's handcrafted pottery from consumers is highly seasonal, peaking in the spring as people purchase pottery for outdoor use and home decor. This seasonal demand ripples up the supply chain from retailers to Locally Made Pottery, the manufacturer. The options Locally Made Pottery has for handling this seasonality include adding workers during the peak season, subcontracting out some of the work, building up inventory during the slow months, or building up a backlog of orders that will be delivered late to customers. To determine how to best use these options through an aggregate plan, Locally Made Pottery's vice president of supply chain starts with the first taskbuilding a demand forecast. Although Locally Made Pottery could attempt to forecast this demand itself, a much more accurate forecast comes from a collaborative process used by both Locally Made Pottery and its retailers to produce the forecast shown in Table mathbf below. It is important that this demand accounts for the product mix expected to sell and is expressed in terms of aggregate units defined earlier.
Locally Made Pottery sells each item through retailers for $ The company has a starting inventory in January of pottery items. At the beginning of January, the company has a workforce of employees.
The plant has a total of working days in each month, and each employee earns $ per hour for regular time. Each employee works eight hours per day on straight time, with overtime as needed. As discussed previously, the capacity of the production operation is determined primarily by the total labor hours worked, and machine capacity does not limit production. Because of labor rules, no employee works more than hours of overtime per month.
The various costs are shown in Table
Currently, Locally Made Pottery has no limits on subcontracting, inventories, and stockoutsbacklog All stockouts are backlogged and supplied from the following month's production. Inventory costs are incurred on the ending inventory each month. The supply chain manager's goal is to obtain the optimal aggregate plan that allows Locally Made Pottery to end June with at least units ie no stockouts at the end of June and at least units in inventory
The optimal aggregate plan is one that results in the highest profit over the sixmonth planning horizon. For now, given Locally Made Pottery's desire for a high level of customer service, assume all demand is to be met, even if it is met late. Therefore, the revenues earned over the planning horizon are fixed. As a result, minimizing cost over the planning horizon is the same as maximizing profit. In other instances, a company may have the option of not meeting certain demand, or price itself may be a variable that a company has to determine based on the aggregate plan. In such cases, minimizing cost is not equivalent to maximizing profits.
Note
For every month, have separate rows for labour hired, labour laid off and then calculate labour employed based on previous labour labour employed labour laid off. Use the labour hired cell for total hiring cost, labour laid off cell for total layoff cost. When we use MAX or IF formulas with solver, Excel tends to get confused.
Try running solver a few times, since it may not give the correct answer in the first run.
For any errors or help, feel free to use an appropriate LLM
Step by Step Solution
There are 3 Steps involved in it
1 Expert Approved Answer
Step: 1 Unlock

Question Has Been Solved by an Expert!
Get step-by-step solutions from verified subject matter experts
Step: 2 Unlock
Step: 3 Unlock