

Question: solve for these please with information provided Please answer questions 39 to 42 based on the following income statement, balance sheet, and capital expen Kappa
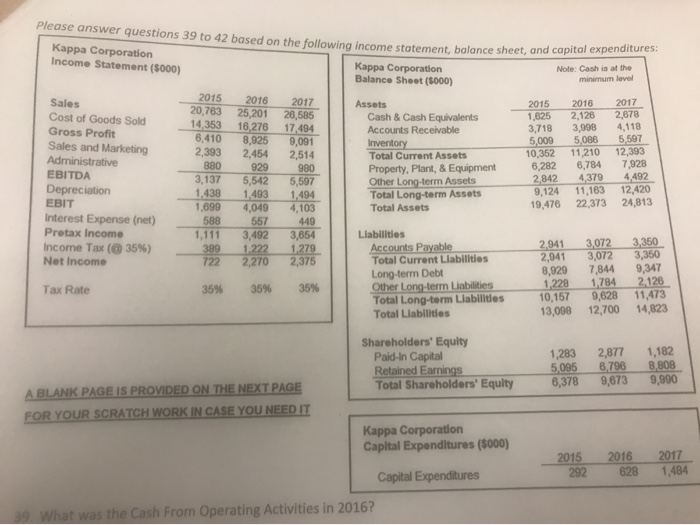
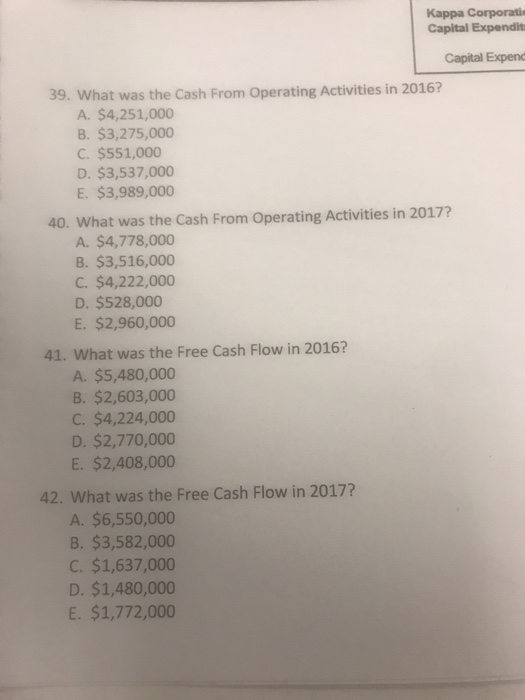
Please answer questions 39 to 42 based on the following income statement, balance sheet, and capital expen Kappa Corporation Income Statement ($000) Kappa Corporation Balance Sheet ($000) Note: Cash at the minimum level 2015 2016 2017 20,763 25,201 26,585 2015 2016 2017 1,625 2,126 2,678 3,718 3,998 4,118 5,009 5,086 ,597 10,352 11,210 12,393 6,282 6,784 7,928 2842 4379 4,492 9,124 11,163 12,420 19,476 22,373 24,813 Cost of Goods Sold 14353 16,276 17494 Cash & Cash Equivalents Accounts Receivable Gross Profit Sales and Marketing Administrative EBITDA Depreciation EBIT Interest Expense (net) Pretax Income Income Tax (@ 35%) Net Income 6,410 8,925 9,091 2,393 2,454 2,514 Total Current Assets Property, Plant,&Equipment Other Long-term Assets Total Long-term Assets Total Assets 1.438 1493 1,494 1,699 4,049 4,103 588 557 449 ,111 3,492 3,654 Liabilities 2941 3072 3,350 2,941 3,072 3,350 8,920 7,844 9,347 1228 1784 2126 9,628 Accounts Payable Total Current Liabilities Long-term Debt Other Long-term Liabilities Total Long-term Liablities10,157 722 2,270 35% 35% Tax Rate 35% 11,473 13,008 12,700 14,823 Total Liabilities Shareholders' Equity 1,283 2,877 1,182 796 8,808 Paid-n Capital 6,378 9,673 9,990 Total Shareholders'Equity BLANK PAGE IS PROVIDED ON THE NEXT PAGE FOR YOUR SCRATCH WORK IN CASE YOU NEED IT Kappa Corporation Capital Expenditures ($000) 2015 2016 2017 292 628 1,484 Capital Expenditures From Operating Activities in 2016? Kappa Corporati Capital Expendit Capital Expenc 39. What was the Cash From Operating Activities in 2016? A. $4,251,000 B. $3,275,000 C. $551,000 D. $3,537,000 E $3,989,000 40. What was the Cash From Operating Activities in 2017? A. $4,778,000 B. $3,516,000 C. $4,222,000 D. $528,000 E. $2,960,000 41. What was the Free Cash Flow in 2016? A. $5,480,000 B. $2,603,000 C. $4,224,000 D. $2,770,000 E. $2,408,000 42. What was the Free Cash Flow in 2017? A. $6,550,000 B. $3,582,000 C. $1,637,000 D. $1,480,000 E. $1,772,000 Please answer questions 39 to 42 based on the following income statement, balance sheet, and capital expen Kappa Corporation Income Statement ($000) Kappa Corporation Balance Sheet ($000) Note: Cash at the minimum level 2015 2016 2017 20,763 25,201 26,585 2015 2016 2017 1,625 2,126 2,678 3,718 3,998 4,118 5,009 5,086 ,597 10,352 11,210 12,393 6,282 6,784 7,928 2842 4379 4,492 9,124 11,163 12,420 19,476 22,373 24,813 Cost of Goods Sold 14353 16,276 17494 Cash & Cash Equivalents Accounts Receivable Gross Profit Sales and Marketing Administrative EBITDA Depreciation EBIT Interest Expense (net) Pretax Income Income Tax (@ 35%) Net Income 6,410 8,925 9,091 2,393 2,454 2,514 Total Current Assets Property, Plant,&Equipment Other Long-term Assets Total Long-term Assets Total Assets 1.438 1493 1,494 1,699 4,049 4,103 588 557 449 ,111 3,492 3,654 Liabilities 2941 3072 3,350 2,941 3,072 3,350 8,920 7,844 9,347 1228 1784 2126 9,628 Accounts Payable Total Current Liabilities Long-term Debt Other Long-term Liabilities Total Long-term Liablities10,157 722 2,270 35% 35% Tax Rate 35% 11,473 13,008 12,700 14,823 Total Liabilities Shareholders' Equity 1,283 2,877 1,182 796 8,808 Paid-n Capital 6,378 9,673 9,990 Total Shareholders'Equity BLANK PAGE IS PROVIDED ON THE NEXT PAGE FOR YOUR SCRATCH WORK IN CASE YOU NEED IT Kappa Corporation Capital Expenditures ($000) 2015 2016 2017 292 628 1,484 Capital Expenditures From Operating Activities in 2016? Kappa Corporati Capital Expendit Capital Expenc 39. What was the Cash From Operating Activities in 2016? A. $4,251,000 B. $3,275,000 C. $551,000 D. $3,537,000 E $3,989,000 40. What was the Cash From Operating Activities in 2017? A. $4,778,000 B. $3,516,000 C. $4,222,000 D. $528,000 E. $2,960,000 41. What was the Free Cash Flow in 2016? A. $5,480,000 B. $2,603,000 C. $4,224,000 D. $2,770,000 E. $2,408,000 42. What was the Free Cash Flow in 2017? A. $6,550,000 B. $3,582,000 C. $1,637,000 D. $1,480,000 E. $1,772,000
Step by Step Solution
There are 3 Steps involved in it

Get step-by-step solutions from verified subject matter experts