

Question: solve in Excel need a chart in this issue TASK 1 (25 Marks) A construction company stores various construction materials in its central stores as
solve in Excel 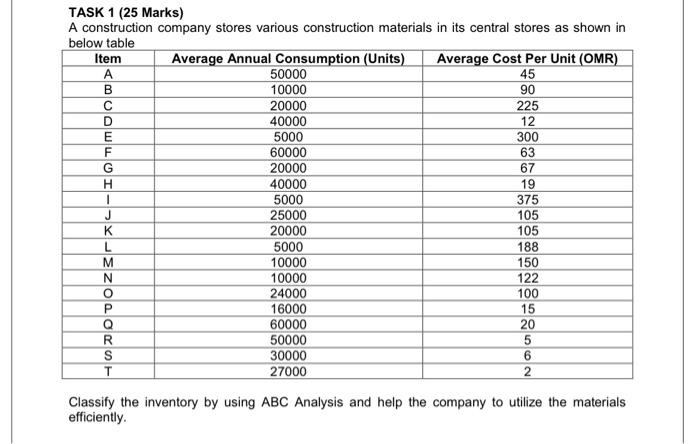
need a chart in this issue

Step by Step Solution
There are 3 Steps involved in it
1 Expert Approved Answer
Step: 1 Unlock

Question Has Been Solved by an Expert!
Get step-by-step solutions from verified subject matter experts
Step: 2 Unlock
Step: 3 Unlock