

Question: solve it as soon as possible in c++ write the code do not use vectors TASK 1: The powerShop does business in electric vehicle(e-vehicle) batteries.
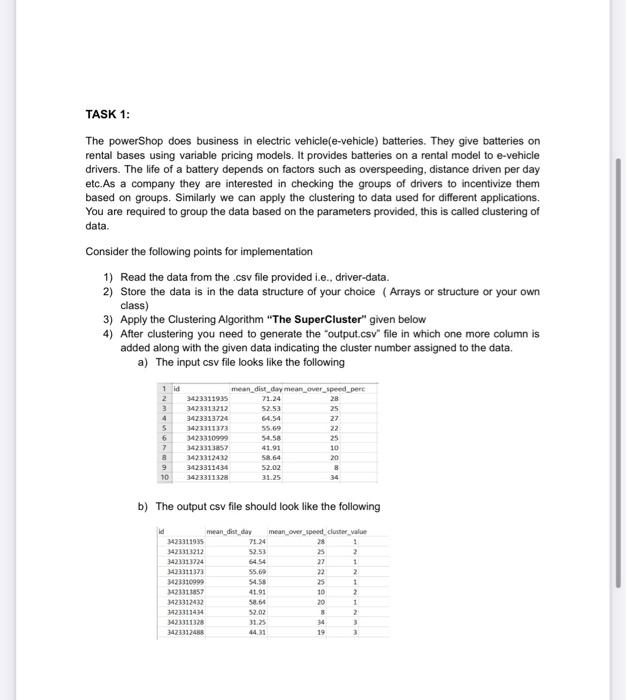
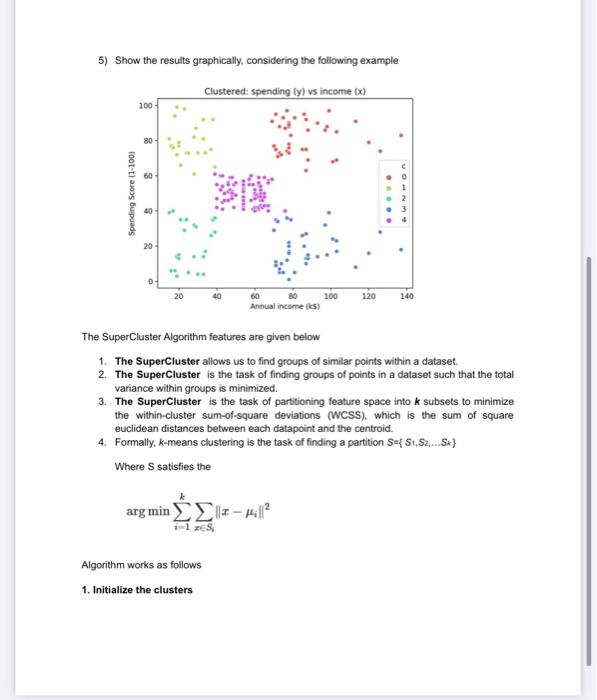
TASK 1: The powerShop does business in electric vehicle(e-vehicle) batteries. They give batteries on rental bases using variable pricing models. It provides batteries on a rental model to e-vehicle drivers. The life of a battery depends on factors such as overspeeding, distance driven per day etc.As a company they are interested in checking the groups of drivers to incentivize them based on groups. Similarly we can apply the clustering to data used for different applications. You are required to group the data based on the parameters provided, this is called clustering of data. Consider the following points for implementation 1) Read the data from the .csv file provided i.e., driver-data. 2) Store the data is in the data structure of your choice (Arrays or structure or your own class) 3) Apply the Clustering Algorithm "The SuperCluster" given below 4) After clustering you need to generate the "output.csv" file in which one more column is added along with the given data indicating the cluster number assigned to the data. a) The input csv file looks like the following b) The output csv file should look like the following 5) Show the results graphically, considering the following example The SuperCluster Algorithm features are given below 1. The SuperCluster allows us to find groups of similar points within a dataset. 2. The SuperCluster is the task of finding groups of points in a dataset such that the total variance within groups is minimized. 3. The SuperCluster is the task of partitioning feature space into k subsets to minimize the within-cluster sum-of-square deviations (WCSS). which is the sum of square euclidean distances between each datapoint and the centroid. 4. Formally, k-means clustering is the task of finding a partition S={S1,S2,.Sk} Where S satisfies the argmini=1kxSjxi2 Algorithm works as follows 1. Initialize the clusters Randomly select k points which become 'markers', then assign each datapoint to its nearest marker point. The result of this is k clusters ( 3 to 5 as a number). After choosing the value for k, assign them some random values 2. Assign each point to the nearest centroid and redefine the cluster If a point currently in cluster 1 is actually closer to the centroid of cluster 2, surely it makes more sense for it to belong to cluster 2? This is exactly what we do, looping over all points and assigning them to clusters based on which centroid is the closest. That is to assign data points to the nearest centroid. 3. Reassign centroid of each cluster We then repeatedly recompute centroids and reassign points to the nearest centroid. TASK 2: Now that you have implemented the 2D data clustering algorithm using C++. The next task is to implement all the above steps for three dimensional data, i.e., load your data into a 3D matrix (age, annual_income and spending_score). Consider the following points for implementation 1) Read the data from the .csv file provided i.e., segmented_customers. This input file contains the basic information (ID, age, gender, income, spending score) about the customers of a mall. Spending Score is something you assign to the customer based on your defined parameters like customer behavior and purchasing data. You are required to group the data based on the parameters provided. 2) Now store the data is in the data structure of your choice (Arrays or structure or your own class) 3) Apply the Clustering Algorithm "The SuperCluster" 4) After clustering you need to generate the "output.csv" file in which one more column is added along with the given data indicating the cluster number assigned to the data. 5) Show the results graphically as mentioned in Task 1
Step by Step Solution
There are 3 Steps involved in it

Get step-by-step solutions from verified subject matter experts