

Question: Solve it correctly please. I will rate accordingly with multiple votes. Ty-ped answer please. Green et al. (2005) estimate the supply and demand curves for
Solve it correctly please. I will rate accordingly with multiple votes. Ty-ped answer please.
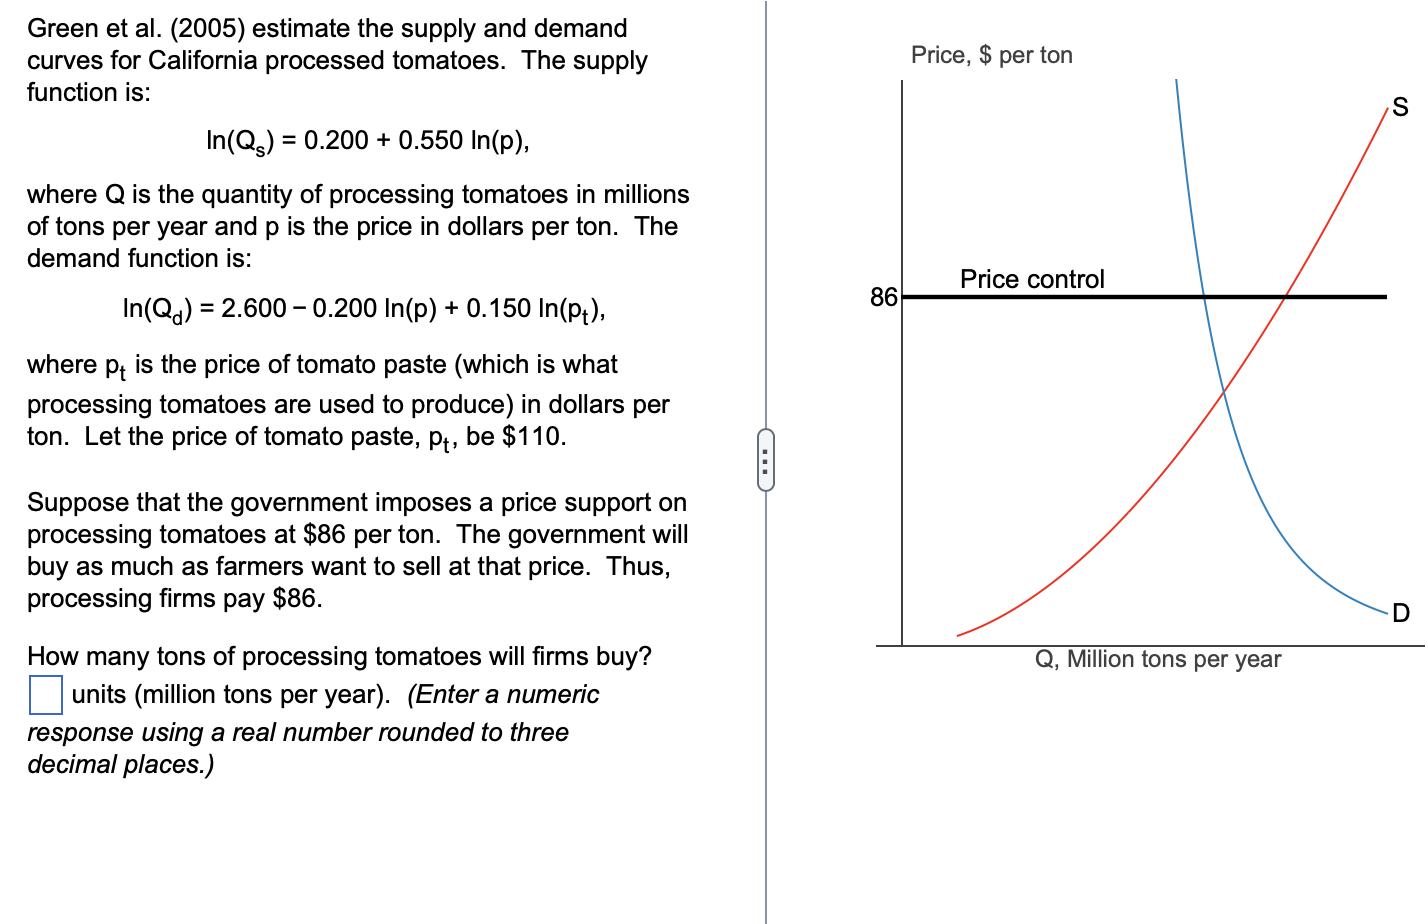
Green et al. (2005) estimate the supply and demand curves for California processed tomatoes. The supply Price, $ per ton function is: S In(Qs) = 0.200 + 0.550 In(p), where Q is the quantity of processing tomatoes in millions of tons per year and p is the price in dollars per ton. The demand function is: Price control In(Q) = 2.600 - 0.200 In(p) + 0.150 In(Pt), 86 where pt is the price of tomato paste (which is what processing tomatoes are used to produce) in dollars per ton. Let the price of tomato paste, pt, be $110. Suppose that the government imposes a price support on processing tomatoes at $86 per ton. The government will buy as much as farmers want to sell at that price. Thus, processing firms pay $86. D How many tons of processing tomatoes will firms buy? Q, Million tons per year units (million tons per year). (Enter a numeric response using a real number rounded to three decimal places.)
Step by Step Solution
There are 3 Steps involved in it

Get step-by-step solutions from verified subject matter experts