

Question: solve it please all the questions Summary statistics for the scores of the 27 students who completed a Dental Anxiety Scale questionnaire are x= 10.6
solve it please all the questions
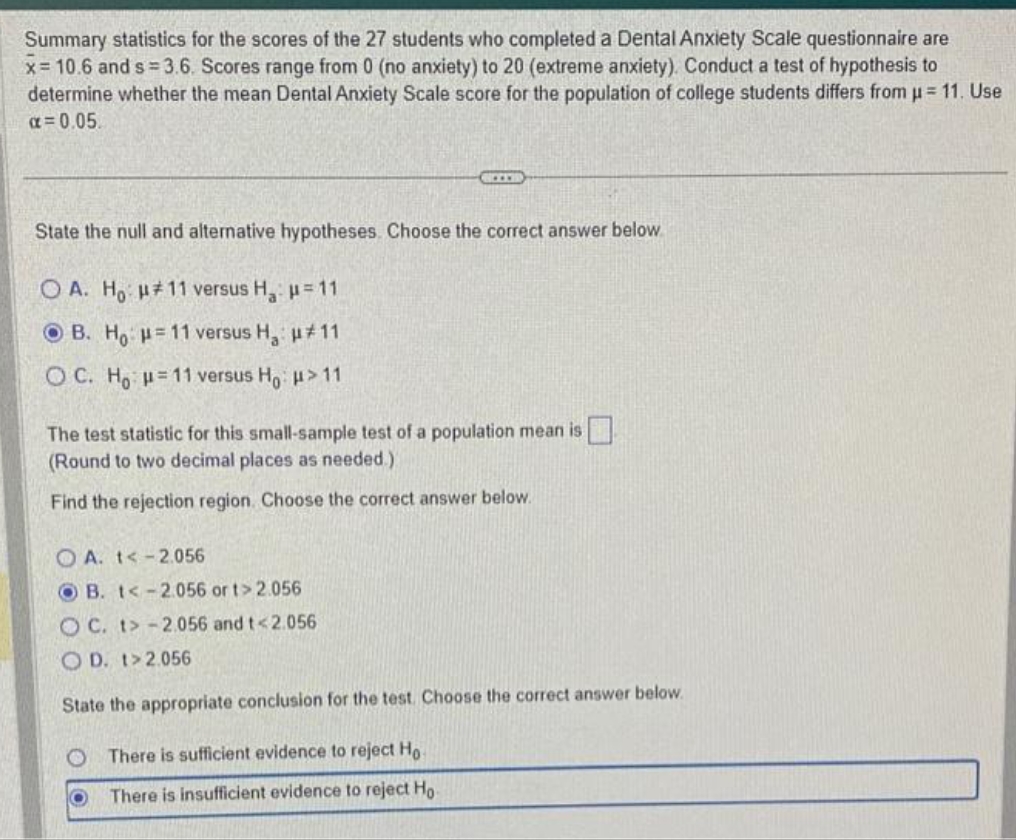
Summary statistics for the scores of the 27 students who completed a Dental Anxiety Scale questionnaire are x= 10.6 and s = 3.6. Scores range from 0 (no anxiety) to 20 (extreme anxiety). Conduct a test of hypothesis to determine whether the mean Dental Anxiety Scale score for the population of college students differs from u = 11. Use a = 0.05. State the null and alternative hypotheses. Choose the correct answer below O A. Ho H# 11 versus Has u =11 O B. Ho H = 11 versus Ha : H # 11 O C. Ho H= 11 versus Ho H> 11 The test statistic for this small-sample test of a population mean is (Round to two decimal places as needed.) Find the rejection region. Choose the correct answer below. A. 1 2.056 O C. t> - 2.056 and t 2.056 State the appropriate conclusion for the test. Choose the correct answer below. There is sufficient evidence to reject Ho There is insufficient evidence to reject Ho
Step by Step Solution
There are 3 Steps involved in it

Get step-by-step solutions from verified subject matter experts