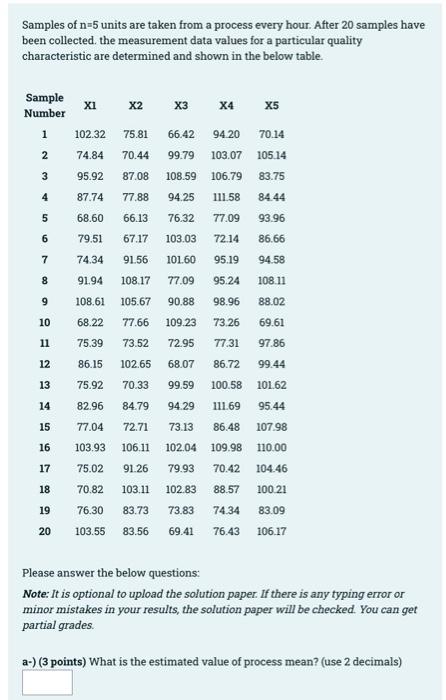
Question: solve it please .. I will give you up rate start with (e) Samples of n=5 units are taken from a process every hour. After

solve it please .. I will give you up rate start with (e)
solve it please .. I will give you up rate start
Samples of n=5 units are taken from a process every hour. After 20 samples have been collected the measurement data values for a particular quality characteristic are determined and shown in the below table X1 X2 X3 X4 X5 Sample Number 1 102.32 75.81 66.42 70.14 2 74.84 70.44 99.79 94.20 103.07 106.79 105.14 3 95.92 87.08 108.59 83.75 4 87.74 77.88 94.25 111.58 84.44 5 68.60 66.13 76.32 77.09 93.96 6 79.51 67.17 103.03 7214 86.66 7 74.34 91.56 101.60 95.19 94.58 108.11 8 91.94 108.17 77.09 95.24 9 108.61 90.88 98.96 88.02 105.67 77.66 10 68.22 109.23 73.26 69.61 11 75.39 73.52 72.95 77.31 97.86 12 86.15 102.65 68.07 86.72 99.44 13 75.92 70.33 100.58 101.62 99.59 94.29 14 82.96 84.79 111.69 95.44 15 77.04 72.71 73.13 86.48 107.98 16 103.93 106.11 91.26 17 75.02 18 70.82 102.04 109.98 110.00 79.93 70.42 104.46 102.83 88.57 100.21 73.83 74.34 83.09 69.41 76.43 106.17 19 103.11 83.73 83.56 76.30 103.55 20 Please answer the below questions: Note: It is optional to upload the solution paper. If there is any typing error or minor mistakes in your results, the solution paper will be checked. You can get partial grades a-) (3 points) What is the estimated value of process mean? (use 2 decimals) b-) (3 points) What is the estimated value of process standard deviation? (use 2 decimals) C-) (3 points) What is the LCL for the X-bar control chart? (use 2 decimals) d-) (3 points) What is the UCL for the X-bar control chart? (use 2 decimals) e-) (3 points) What is the LCL for the s control chart? (use 2 decimals) f-) (3 points) What is the UCL for the s control chart? (use 2 decimals) g-) (2 points) Check the samples data value with the calculated control limits value. Is the process in control? h-) (3 Points) If NO (the process is not in control) which sample is out of control limits: i-) (2 points) What is the revised LCL for the X-bar control chart? (use 2 decimals) ;-) (2 points) What is the revised UCL for the X-bar control chart? (use 2 decimals) k-) (2 points) What is the LCL for the revised s control chart? (use 2 decimals) 1-) (2 points) What is the UCL for the revised s control chart? (use 2 decimals) m-) (3 points) If the quality characteristic is normally distributed and if the specifications are 100+30, what is the potential process capability (Cp) be)? n-) (2 points) According to the calculated Cp value in part "m" can the process meet the specifications? 0-) (3 points) If the quality characteristic is normally distributed and if the specifications are 100+30, what is the lower process capability (Cpi) be)? (use 2 decimals) P-) (3 points) If the quality characteristic is normally distributed and if the specifications are 100+30, what is upper process capability (Cpu) be)? (use 2 decimals) 9-) (2 points) If the quality characteristic is normally distributed and if the specifications are 100+30, what is the actual process capability (Cpk) be)? (use 2 decimals) r-) (6 points) According to the calculated process capability ratio values above. what percentage of the specification band is used up by the process? (use 2 decimals)

Step by Step Solution

There are 3 Steps involved in it

1 Expert Approved Answer
Step: 1 Unlock blur-text-image
Question Has Been Solved by an Expert!

Get step-by-step solutions from verified subject matter experts

Step: 2 Unlock
Step: 3 Unlock

Students Have Also Explored These Related General Management Questions!