

Question: Solve it please MAPIC Teaser Mathematical Models This graph shows the minimum high school GPA required for entry to a university for the post year.
Solve it please
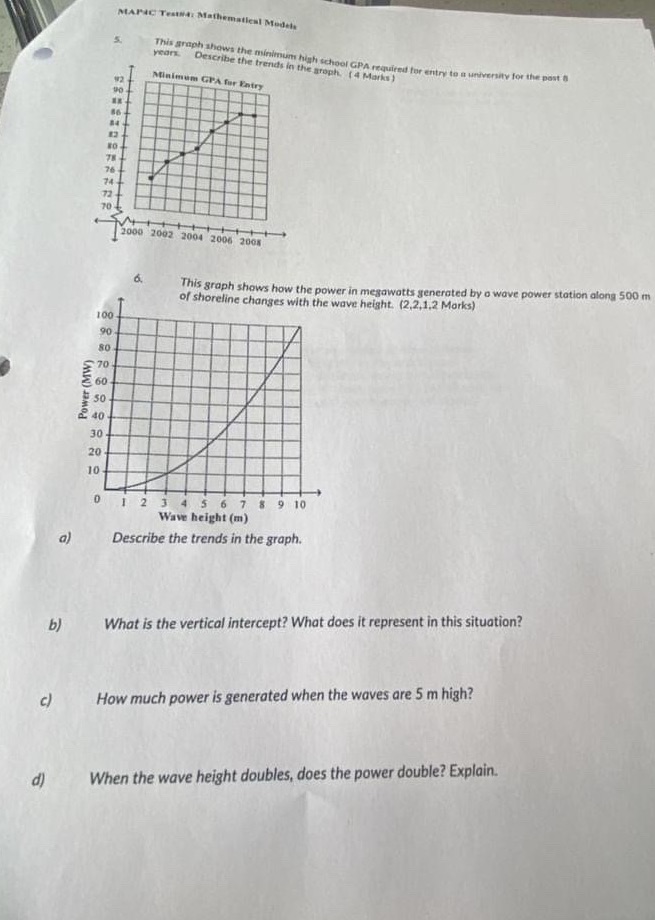
MAPIC Teaser Mathematical Models This graph shows the minimum high school GPA required for entry to a university for the post year. Describe the trends in the groph. ( 4 Marks ) Minimum GPA for Entry UO 84 112 78 76 74 72 70 2000 2092 2004 2006 2008 6. This graph shows how the power in megawatts generated by a wave power station along 500 m of shoreline changes with the wave height. (2,2.1.2 Marks) 100 90 Power (MW) 10 0 8 9 10 Wave height (m) a) Describe the trends in the graph. What is the vertical intercept? What does it represent in this situation? b) How much power is generated when the waves are 5 m high? c) When the wave height doubles, does the power double? Explain. d)
Step by Step Solution
There are 3 Steps involved in it

Get step-by-step solutions from verified subject matter experts