

Question: solve it soon Question 3: The table below shows the result of an experimental study conducted by a group of civil engineering students on the
solve it soon
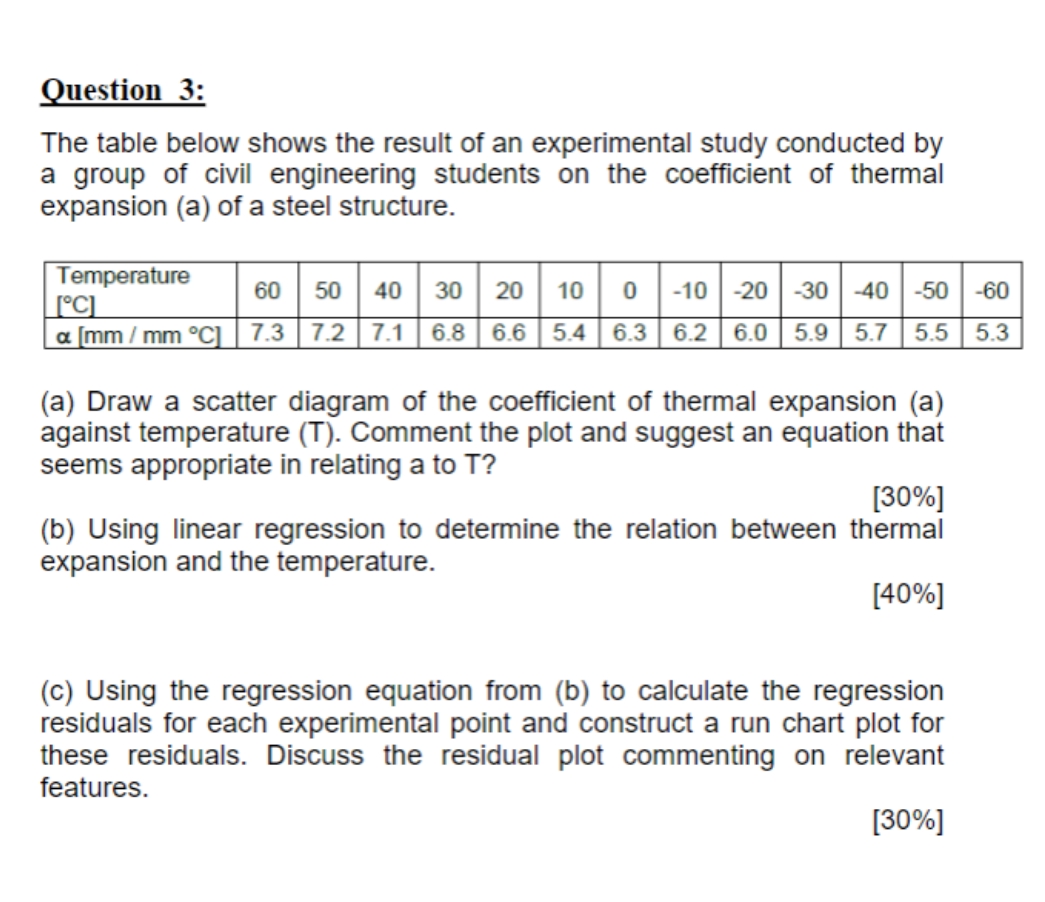
Question 3: The table below shows the result of an experimental study conducted by a group of civil engineering students on the coefficient of thermal expansion (a) of a steel structure. Temperature [.C] 60 50 40 30 20 10 0 -10 -20 -30 -40 -50 -60 a [mm / mm C] 7.3 7.2 7.1 6.8 6.6 5.4 6.3 6.2 6.0 5.9 5.7 5.5 5.3 (a) Draw a scatter diagram of the coefficient of thermal expansion (a) against temperature (T). Comment the plot and suggest an equation that seems appropriate in relating a to T? [30%] (b) Using linear regression to determine the relation between thermal expansion and the temperature. [40%] (c) Using the regression equation from (b) to calculate the regression residuals for each experimental point and construct a run chart plot for these residuals. Discuss the residual plot commenting on relevant features. [30%]
Step by Step Solution
There are 3 Steps involved in it

Get step-by-step solutions from verified subject matter experts