

Question: Solve it using excel, minitab, and Provide me with steps and final answers, and outputs A poultry scientist was studying various dietary additives to increase
Solve it using excel, minitab, and Provide me with steps and final answers, and outputs
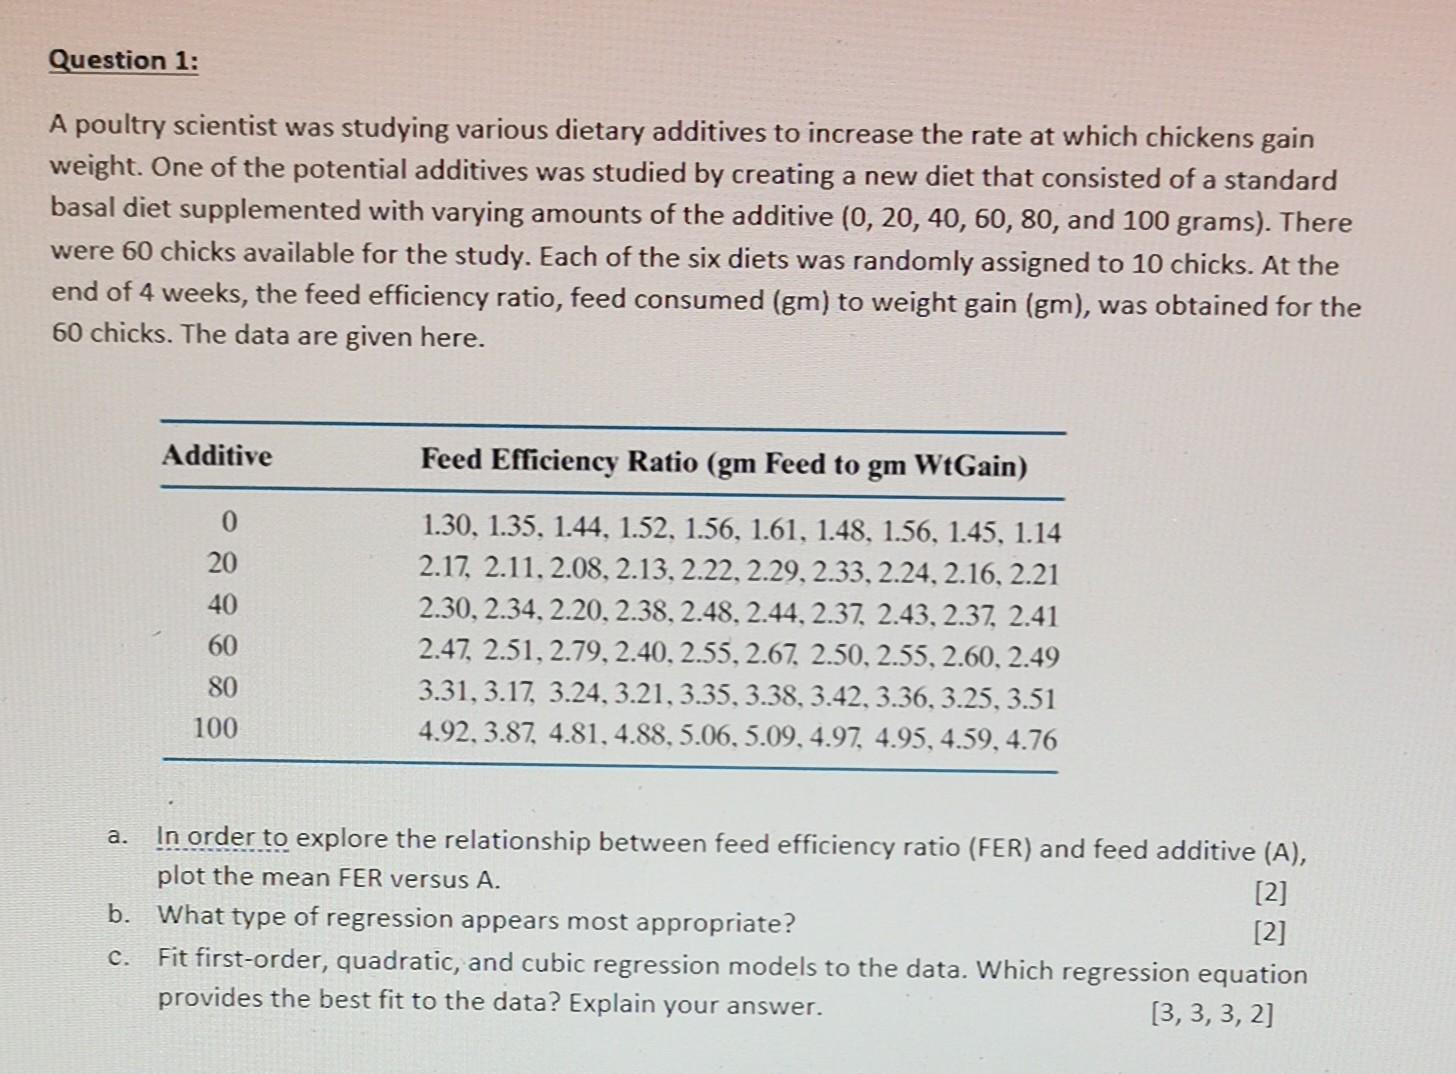
A poultry scientist was studying various dietary additives to increase the rate at which chickens gain weight. One of the potential additives was studied by creating a new diet that consisted of a standard basal diet supplemented with varying amounts of the additive (0,20,40,60,80, and 100 grams). There were 60 chicks available for the study. Each of the six diets was randomly assigned to 10 chicks. At the end of 4 weeks, the feed efficiency ratio, feed consumed (gm) to weight gain (gm), was obtained for the 60 chicks. The data are given here. a. In order to explore the relationship between feed efficiency ratio (FER) and feed additive (A), plot the mean FER versus A. [2] b. What type of regression appears most appropriate? [2] c. Fit first-order, quadratic, and cubic regression models to the data. Which regression equation provides the best fit to the data? Explain your answer. [3,3,3,2]
Step by Step Solution
There are 3 Steps involved in it

Get step-by-step solutions from verified subject matter experts