

Question: ** solve it using excel ** The table below represents the sales quantities for different products. These sales were made by 10 different salesmen in
** solve it using excel **
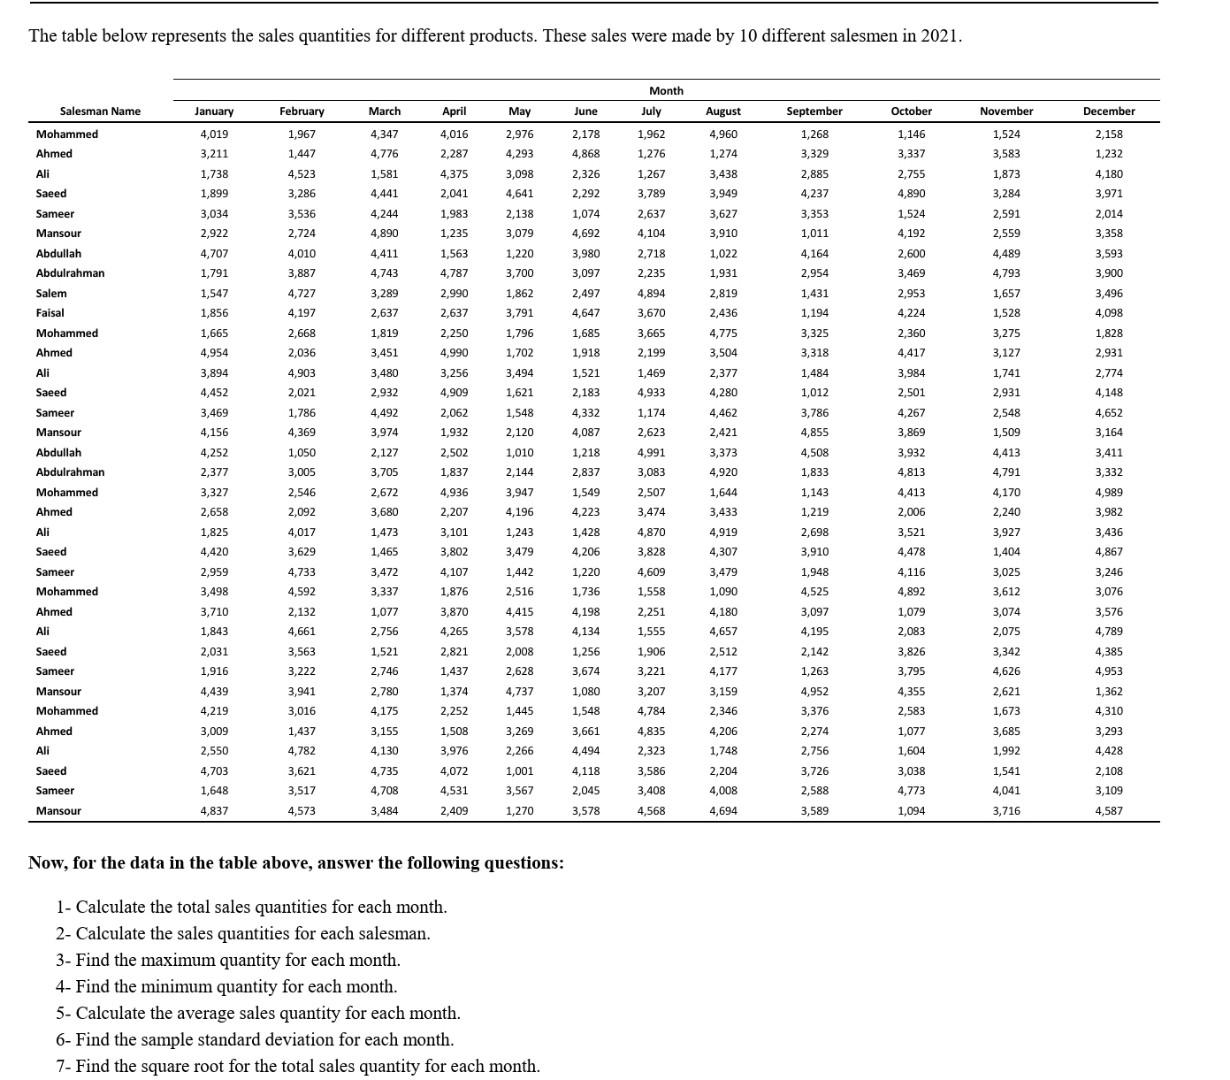
The table below represents the sales quantities for different products. These sales were made by 10 different salesmen in 2021. Month February March April June October November December Salesman Name Mohammed Ahmed May 2,976 4,016 4,347 4,776 July 1,962 1,276 September 1,268 3,329 1,146 3,337 4,293 August 4,960 1,274 3,438 3,949 1,967 1,447 4,523 3,286 3,536 1,581 January 4,019 3,211 1,738 1,899 3,034 2,922 4,707 Ali Saeed 2,287 4,375 2,041 2,178 4,868 2,326 2,292 1,074 1,267 2,755 4,890 2,158 1,232 4,180 3,971 2,014 4,441 4,244 1,983 3,789 2,637 4,104 3,627 3,098 4,641 2,138 3,079 1,220 3,700 2,885 4,237 3,353 1,011 4,164 2,954 2,724 Sameer Mansour Abdullah Abdulrahman 4,692 3,358 4,890 4,411 4,743 1,524 4,192 2,600 1,235 1,563 2,718 3.593 1,791 4,787 2,235 3,469 3,900 1,862 Salem Faisal Mohammed Ahmed Ali 1,547 1,856 1,665 3,791 3,289 2,637 1,819 3,451 2,990 2,637 2,250 4,990 4,894 3,670 3,665 2,199 2,953 4,224 2,360 4,417 4,954 3,894 3,980 3,097 2,497 4,647 1,685 1,918 1,521 2,183 4,332 4,087 1,218 2,837 3,256 4,010 3,887 4,727 4,197 2,668 2,036 4,903 2,021 1,786 4,369 1,050 3,005 2,546 2,092 1,796 1,702 3,494 1,621 1,548 3,480 2,932 3,984 3,910 1,022 1,931 2,819 2,436 4,775 3,504 2,377 4,280 4,462 2,421 3,373 4,920 1,644 3,433 1,469 4,933 4,452 2,501 Saeed Sameer 1,431 1,194 3,325 3,318 1,484 1,012 3,786 4,855 4,508 1,833 1,143 1,219 3,469 4,909 2,062 1,932 4,492 1,174 4,267 3,496 4,098 1,828 2,931 2,774 4,148 4,652 3,164 3,411 3,332 4,989 3,982 3,436 4,867 3,974 3,869 2,120 1,010 2,144 2,623 4,991 3,083 2,502 1,837 1,524 3,583 1,873 3,284 2,591 2,559 4,489 4,793 1,657 1,528 3,275 3,127 1,741 2,931 2,548 1,509 4,413 4,791 4,170 2,240 3,927 1,404 3,025 3,612 3,074 2,075 3,342 4,626 2,621 1,673 3,685 1,992 3,932 4,813 2,507 3,947 4,196 1,549 4,223 3,474 4,936 2,207 3,101 3,802 4,017 1,243 1,428 2,698 4,919 4,307 3,479 4,206 Mansour Abdullah Abdulrahman Mohammed Ahmed Ali Saeed Sameer Mohammed Ahmed Ali Saeed Sameer Mansour Mohammed Ahmed 4,870 3,828 4,609 1,558 1,442 1,220 1,736 4,156 4,252 2,377 3,327 2,658 1,825 4,420 2,959 3,498 3,710 1,843 2,031 1,916 4,439 4,219 3,009 2,550 4,703 1,648 4,837 2,127 3,705 2,672 3,680 1,473 1,465 3,472 3,337 1,077 2,756 1,521 2,746 2,780 4,175 3,155 4,130 4,735 3,629 4,733 4,592 2,132 4,661 3,563 3,222 3,941 3,016 4,107 1,876 3,870 4,265 2,516 4,415 3,578 4,198 3,246 3,076 3,576 4,789 2,251 1,555 4,413 2,006 3,521 4,478 4,116 4,892 1,079 2,083 3,826 3,795 4,355 2,583 1,077 1,604 4,134 1,256 2,008 1,906 4,385 3,221 2,821 1,437 1,374 2,252 2,628 4,737 1,445 3,269 2,266 3,910 1,948 4,525 3,097 4,195 2,142 1,263 4,952 3,376 2,274 2,756 3,726 2,588 3,589 3,479 1,090 4,180 4,657 2,512 4,177 3,159 2,346 4,206 1,748 2,204 4,008 4,694 3,207 4,784 4,835 2,323 3,674 1,080 1,548 3,661 4,494 4,118 2,045 3,578 4,953 1,362 4,310 3,293 1,508 1,437 4,782 Ali 3,976 Saeed 3,621 4,072 3,038 1,541 3,586 3,408 4,428 2,108 3,109 3,517 4,708 1,001 3,567 1,270 Sameer Mansour 4,041 4,531 2,409 4,773 1,094 4,573 3,484 4,568 3,716 4,587 Now, for the data in the table above, answer the following questions: 1- Calculate the total sales quantities for each month. 2- Calculate the sales quantities for each salesman. 3- Find the maximum quantity for each month. 4- Find the minimum quantity for each month. 5- Calculate the average sales quantity for each month. 6- Find the sample standard deviation for each month. 7- Find the square root for the total sales quantity for each monthStep by Step Solution
There are 3 Steps involved in it
1 Expert Approved Answer
Step: 1 Unlock

Question Has Been Solved by an Expert!
Get step-by-step solutions from verified subject matter experts
Step: 2 Unlock
Step: 3 Unlock