

Question: Solve it without using minitab . 1 1 - 7 . An article in the Tappi Journal ( March 1 9 8 6 ) presented
Solve it without using minitab
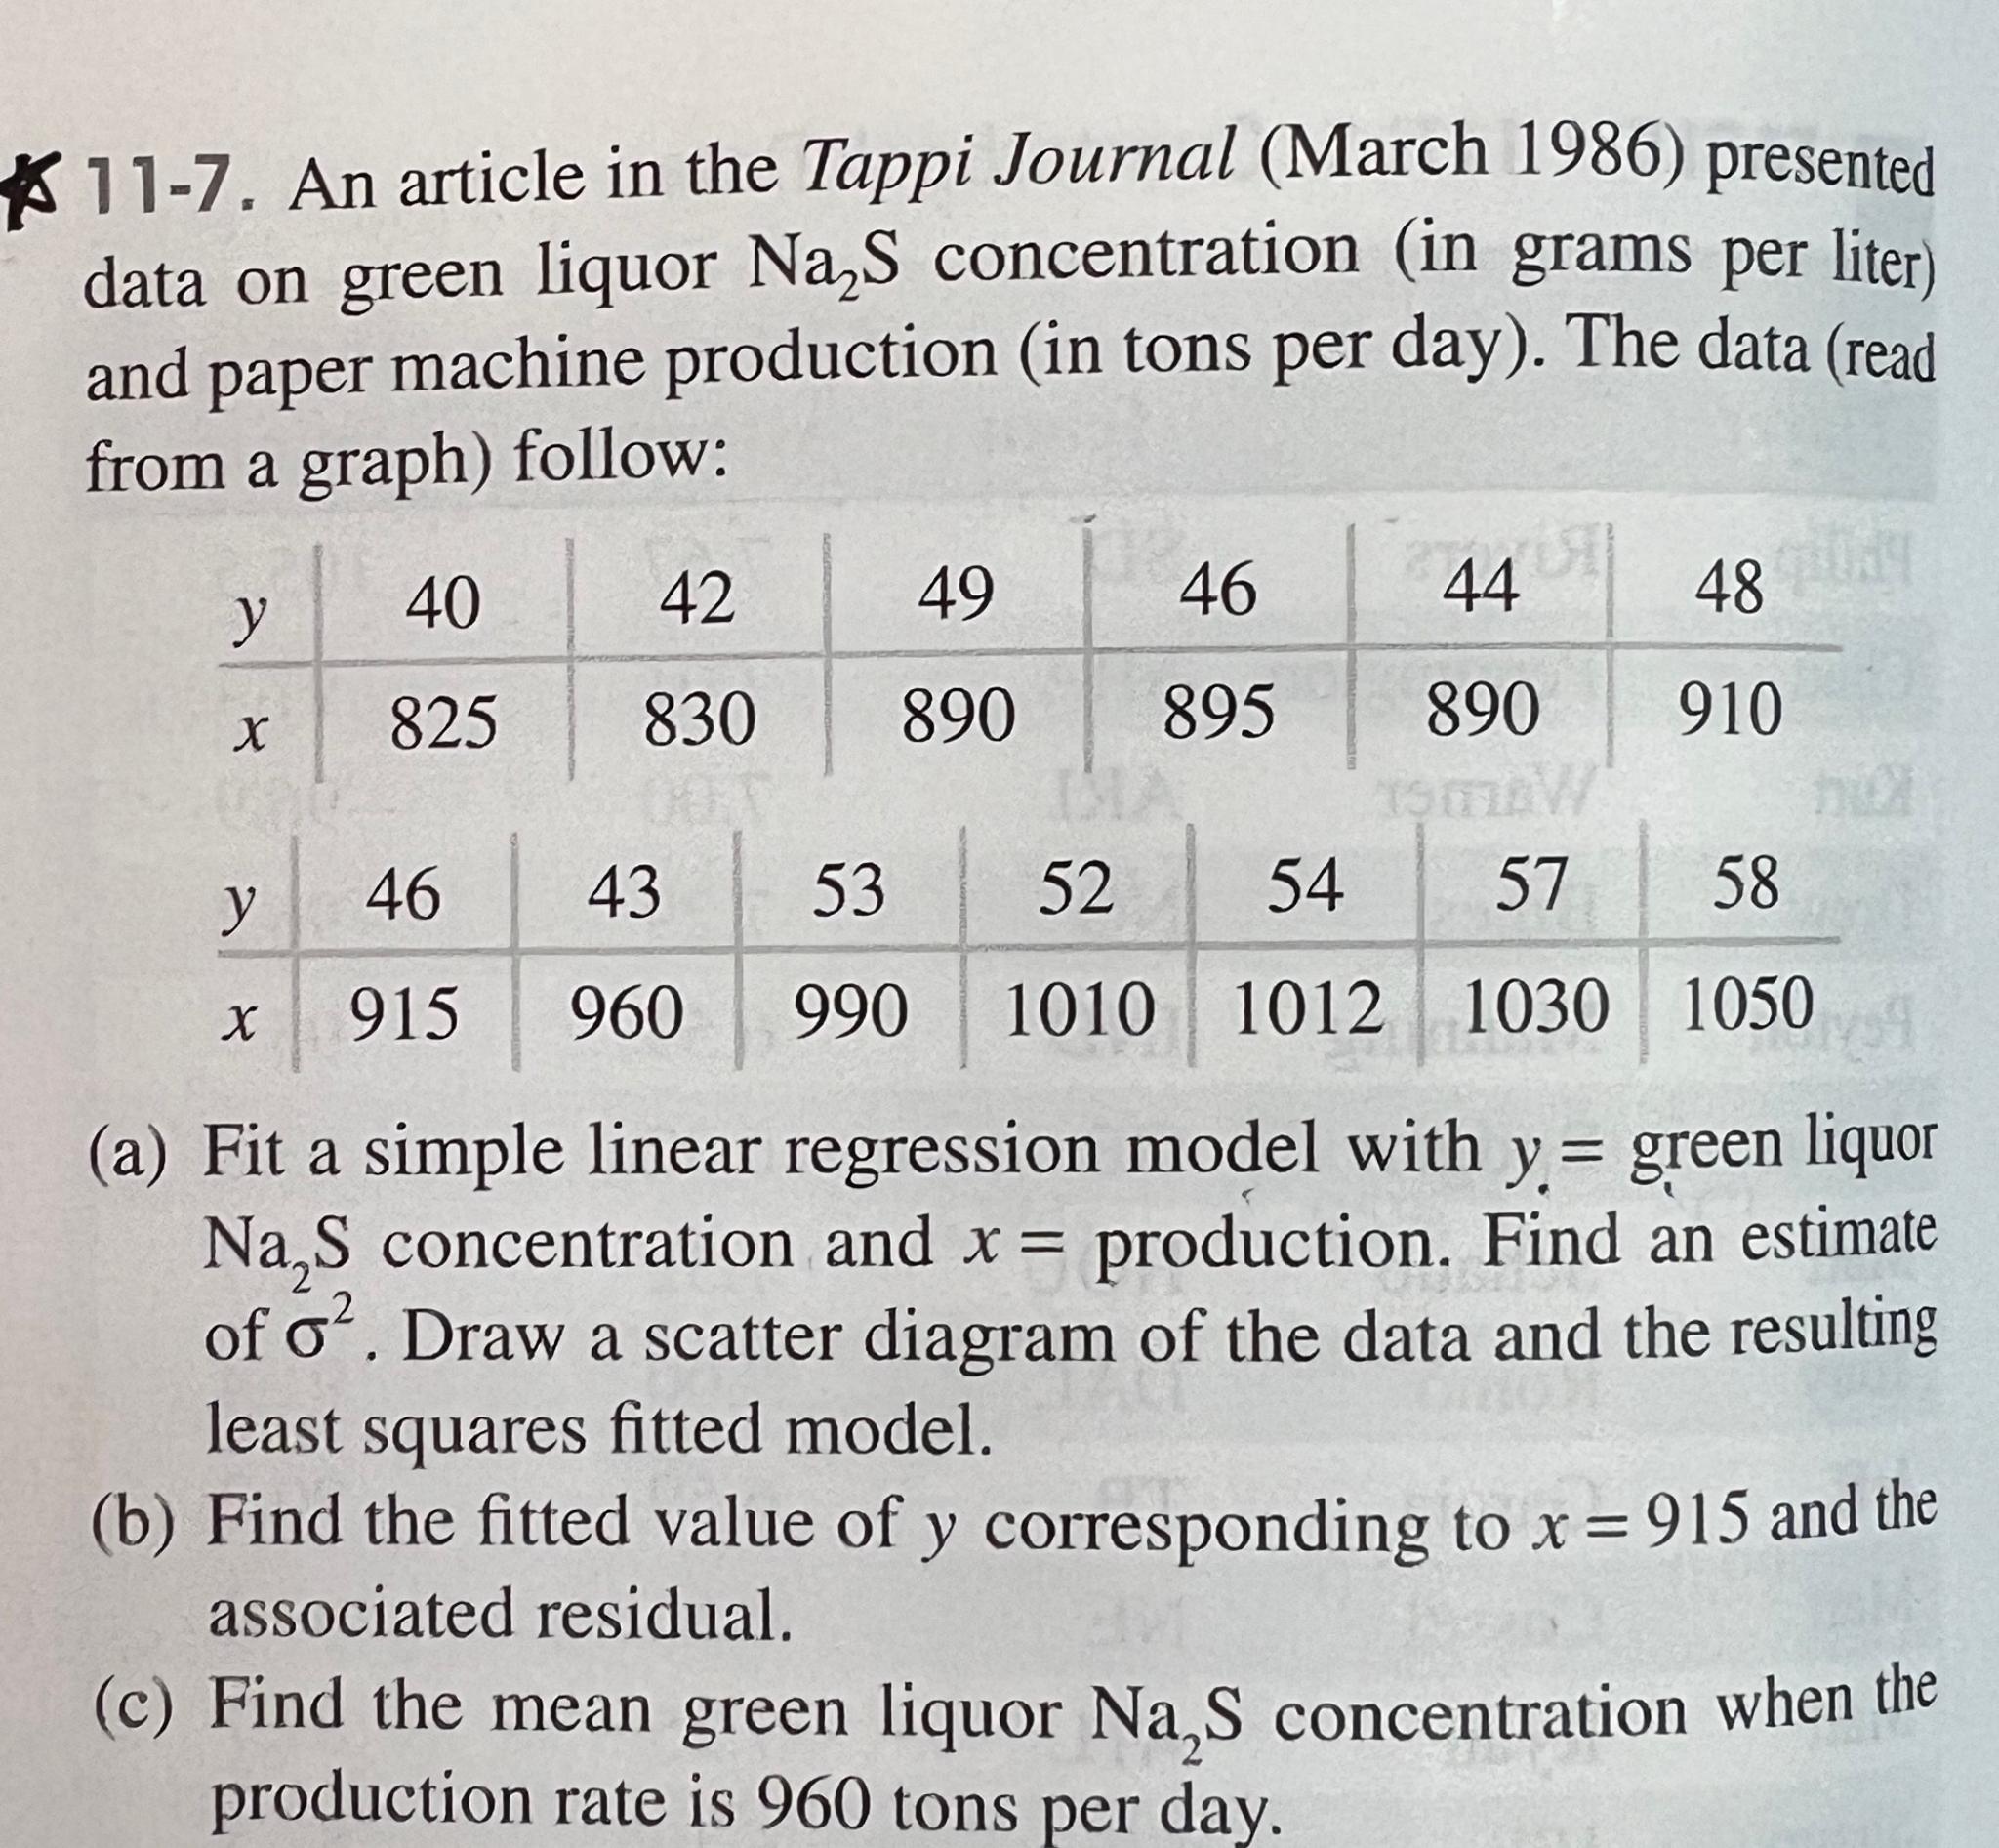
An article in the Tappi Journal March presented data on green liquor concentration in grams per liter and paper machine production in tons per day The data read from a graph follow:
table
table
a Fit a simple linear regression model with green liquor concentration and production. Find an estimate of Draw a scatter diagram of the data and the resulting least squares fitted model.
b Find the fitted value of corresponding to and the associated residual.
c Find the mean green liquor concentration when the production rate is tons per day.
Step by Step Solution
There are 3 Steps involved in it
1 Expert Approved Answer
Step: 1 Unlock

Question Has Been Solved by an Expert!
Get step-by-step solutions from verified subject matter experts
Step: 2 Unlock
Step: 3 Unlock