

Question: Solve manually Note: x = 6 y = 1 z = 2 NOTE: x = 6, y = 1, z = 2 solve manually Situation
Solve manually Note: x = 6 y = 1 z = 2
NOTE: x = 6, y = 1, z = 2
solve manually
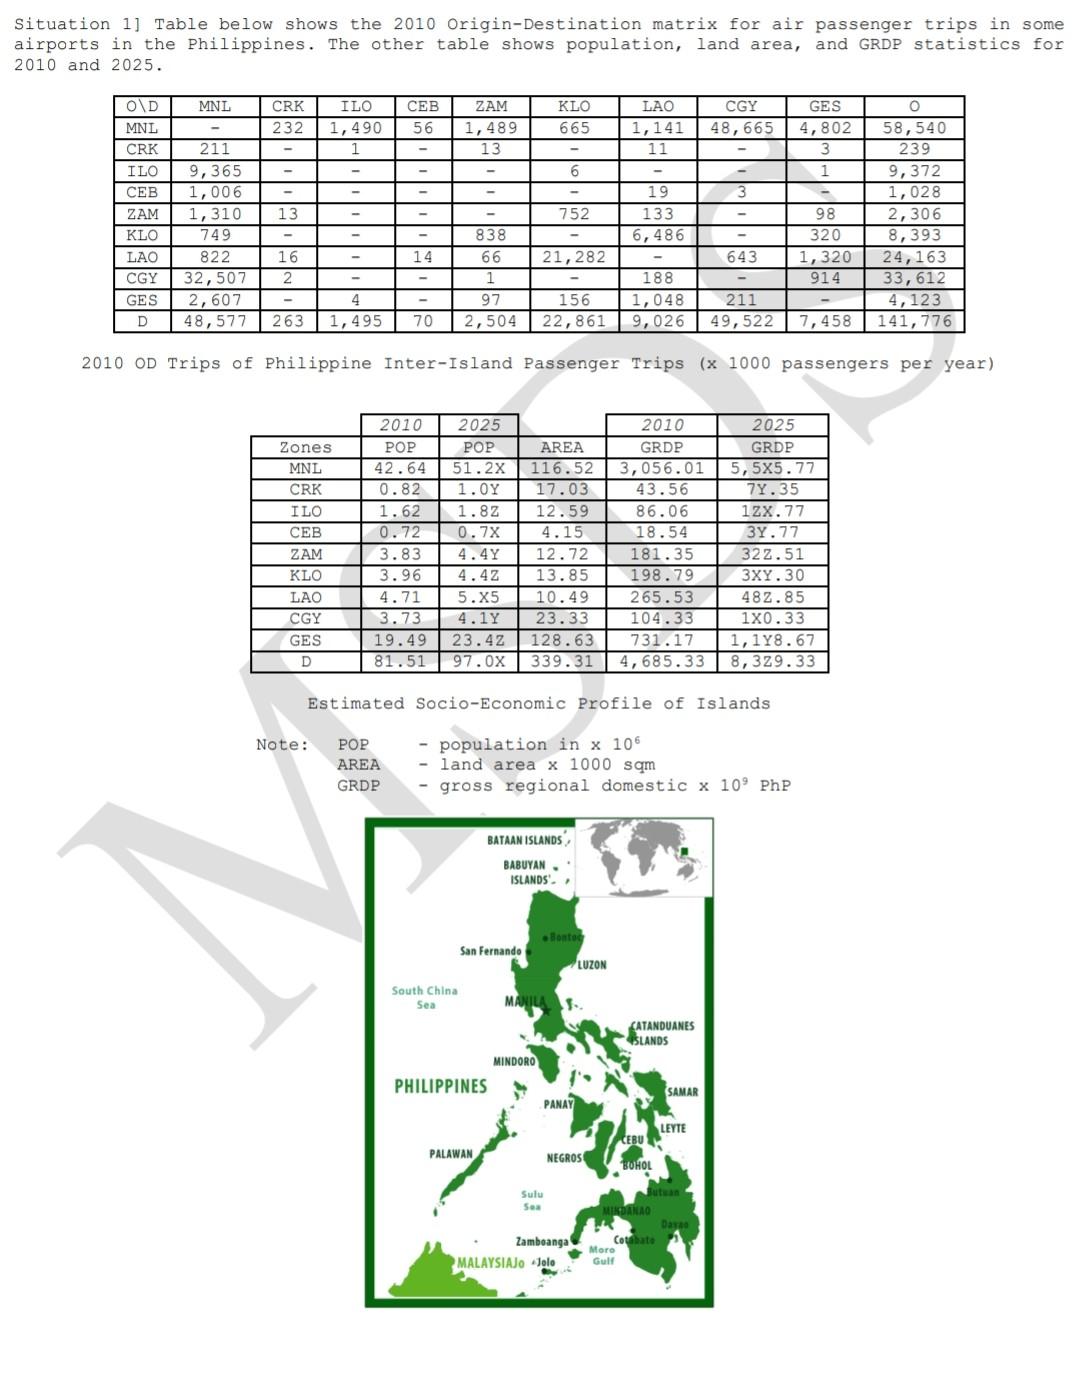
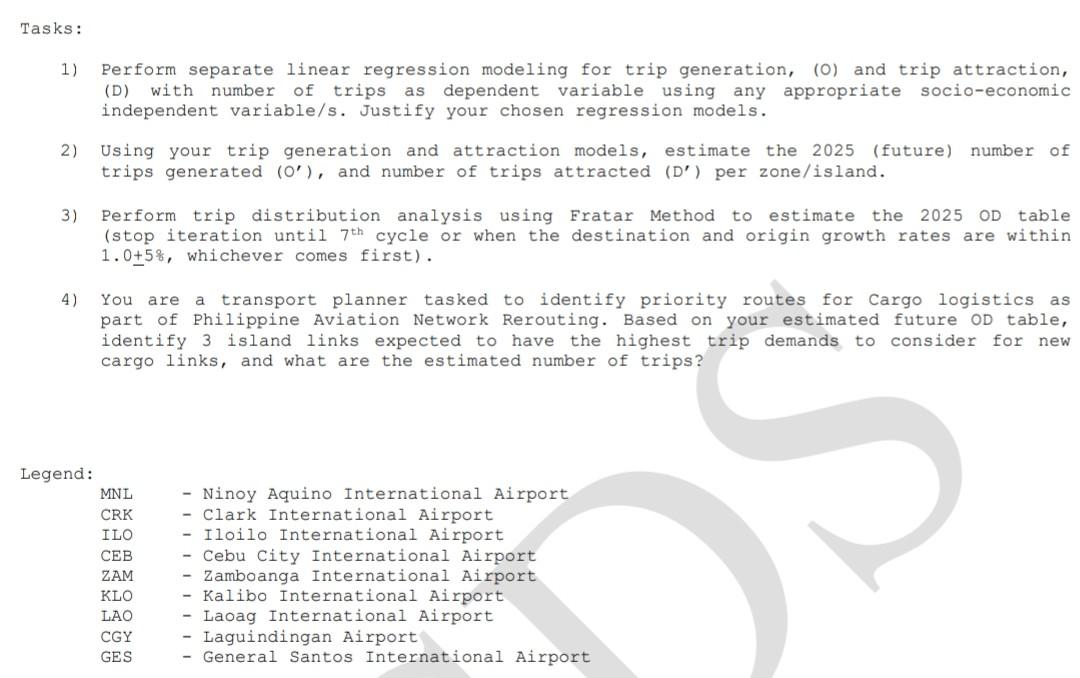
Situation 1] Table below shows the 2010 Origin-Destination matrix for air passenger trips in some airports in the Philippines. The other table shows population, land area, and GRDP statistics for 2010 and 2025. OD MNL CRK 232 ILO 1,490 1 CEB 56 ZAM 1,489 13 KLO 665 LAO 1,141 11 CGY 48,665 6 - 3 MNL CRK ILO CEB ZAM KLO LAO CGY 13 GES 4,802 3 1 - 98 320 1,320 914 211 9,365 1,006 1,310 749 822 32,507 2,607 48,577 752 19 133 6,486 O 58,540 239 9,372 1,028 2,306 8,393 24,163 33, 612 4,123 141,776 14 21, 282 643 16 2. 838 66 1 97 2,504 GES D -- 263 4 1,495 156 22,861 188 1,048 9,026 211 49,522 70 7,458 2010 OD Trips of Philippine Inter-Island Passenger Trips (x 1000 passengers per year) Zones MNL CRK ILO CEB ZAM KLO 2010 POP 42.64 0.82 1.62 0.72 3.83 3.96 4.71 3.73 19.49 81.51 2025 POP 51.2x 1. 1.82 0.7 4.44 4.42 5.X5 4.14 23.42 97.0x AREA 116.52 17.03 12.59 4.15 12.72 13.85 10.49 23.33 128.63 339.31 2010 GRDP 3,056.01 43.56 86.06 18.54 181.35 198.79 265.53 104.33 731.17 4,685.33 2025 GRDP 5,5x5.77 78.35 12x.77 38.77 32 2.51 3XY.30 482.85 1x0.33 1,148.67 8,329.33 LAO CGY GES D Estimated Socio-Economic Profile of Islands Note: POP AREA GRDP population in x 106 land area x 1000 sqm gross regional domestic x 10' Php BATAAN ISLANDS BABUYAN ISLANDS'. Bontee San Fernando LUZON South China Sea MAULA CATANDUANES SLANDS MINDORO PHILIPPINES SAMAR PANAY LEYTE CEBU PALAWAN NEGROS BOHOL Sulu Sea INDANAO Zamboanga MALAYSIAJO Jolo Cordhate Moro Gull Tasks: 1) Perform separate linear regression modeling for trip generation, (0) and trip attraction, (D) with number of trips as dependent variable using any appropriate socio-economic independent variable/s. Justify your chosen regression models. 2) Using your trip generation and attraction models, estimate the 2025 (future) number of trips generated (0'), and number of trips attracted (D') per zone/island. 3) Perform trip distribution analysis using Fratar Method to estimate the 2025 OD table (stop iteration until 7th cycle or when the destination and origin growth rates are within 1.0+5%, whichever comes first). 4) You are a transport planner tasked to identify priority routes for Cargo logistics as part of Philippine Aviation Network Rerouting. Based on your estimated future OD table, identify 3 island links expected to have the highest trip demands to consider for new cargo links, and what are the estimated number of trips? DS Legend: MNL CRK ILO CEB ZAM KLO LAO CGY GES - Ninoy Aquino International Airport - Clark International Airport - Iloilo International Airport - Cebu City International Airport - Zamboanga International Airport - Kalibo International Airport - Laoag International Airport - Laguindingan Airport - General Santos International Airport Situation 1] Table below shows the 2010 Origin-Destination matrix for air passenger trips in some airports in the Philippines. The other table shows population, land area, and GRDP statistics for 2010 and 2025. OD MNL CRK 232 ILO 1,490 1 CEB 56 ZAM 1,489 13 KLO 665 LAO 1,141 11 CGY 48,665 6 - 3 MNL CRK ILO CEB ZAM KLO LAO CGY 13 GES 4,802 3 1 - 98 320 1,320 914 211 9,365 1,006 1,310 749 822 32,507 2,607 48,577 752 19 133 6,486 O 58,540 239 9,372 1,028 2,306 8,393 24,163 33, 612 4,123 141,776 14 21, 282 643 16 2. 838 66 1 97 2,504 GES D -- 263 4 1,495 156 22,861 188 1,048 9,026 211 49,522 70 7,458 2010 OD Trips of Philippine Inter-Island Passenger Trips (x 1000 passengers per year) Zones MNL CRK ILO CEB ZAM KLO 2010 POP 42.64 0.82 1.62 0.72 3.83 3.96 4.71 3.73 19.49 81.51 2025 POP 51.2x 1. 1.82 0.7 4.44 4.42 5.X5 4.14 23.42 97.0x AREA 116.52 17.03 12.59 4.15 12.72 13.85 10.49 23.33 128.63 339.31 2010 GRDP 3,056.01 43.56 86.06 18.54 181.35 198.79 265.53 104.33 731.17 4,685.33 2025 GRDP 5,5x5.77 78.35 12x.77 38.77 32 2.51 3XY.30 482.85 1x0.33 1,148.67 8,329.33 LAO CGY GES D Estimated Socio-Economic Profile of Islands Note: POP AREA GRDP population in x 106 land area x 1000 sqm gross regional domestic x 10' Php BATAAN ISLANDS BABUYAN ISLANDS'. Bontee San Fernando LUZON South China Sea MAULA CATANDUANES SLANDS MINDORO PHILIPPINES SAMAR PANAY LEYTE CEBU PALAWAN NEGROS BOHOL Sulu Sea INDANAO Zamboanga MALAYSIAJO Jolo Cordhate Moro Gull Tasks: 1) Perform separate linear regression modeling for trip generation, (0) and trip attraction, (D) with number of trips as dependent variable using any appropriate socio-economic independent variable/s. Justify your chosen regression models. 2) Using your trip generation and attraction models, estimate the 2025 (future) number of trips generated (0'), and number of trips attracted (D') per zone/island. 3) Perform trip distribution analysis using Fratar Method to estimate the 2025 OD table (stop iteration until 7th cycle or when the destination and origin growth rates are within 1.0+5%, whichever comes first). 4) You are a transport planner tasked to identify priority routes for Cargo logistics as part of Philippine Aviation Network Rerouting. Based on your estimated future OD table, identify 3 island links expected to have the highest trip demands to consider for new cargo links, and what are the estimated number of trips? DS Legend: MNL CRK ILO CEB ZAM KLO LAO CGY GES - Ninoy Aquino International Airport - Clark International Airport - Iloilo International Airport - Cebu City International Airport - Zamboanga International Airport - Kalibo International Airport - Laoag International Airport - Laguindingan Airport - General Santos International Airport
Step by Step Solution
There are 3 Steps involved in it

Get step-by-step solutions from verified subject matter experts