

Question: Solve numerically the IVP d 2 y d t 2 + 3 y d y d t + 6 y = - 3 s i
Solve numerically the IVP
with
in the interval Include the file in your report.
Is the behavior of the solution significantly different from that of the solution of
Is MATLAB giving any warning message? Comment.
THIS CONTENT IS PROTECTED AND MAY NOT BE SHARED, UPLOADED, SOLD OR DISTRIBUTED
v Copyrighto School of Mathematical and Statistical Sciences, Arizona State University
A ThirdOrder Problem
Consider the thirdorder IVP
with
Introducing and we obtain and Moreover,
and Thus is equivalent to
Figure : Time series and left and D phase plot
vs vs for rotated with view ;;;;
;;;;
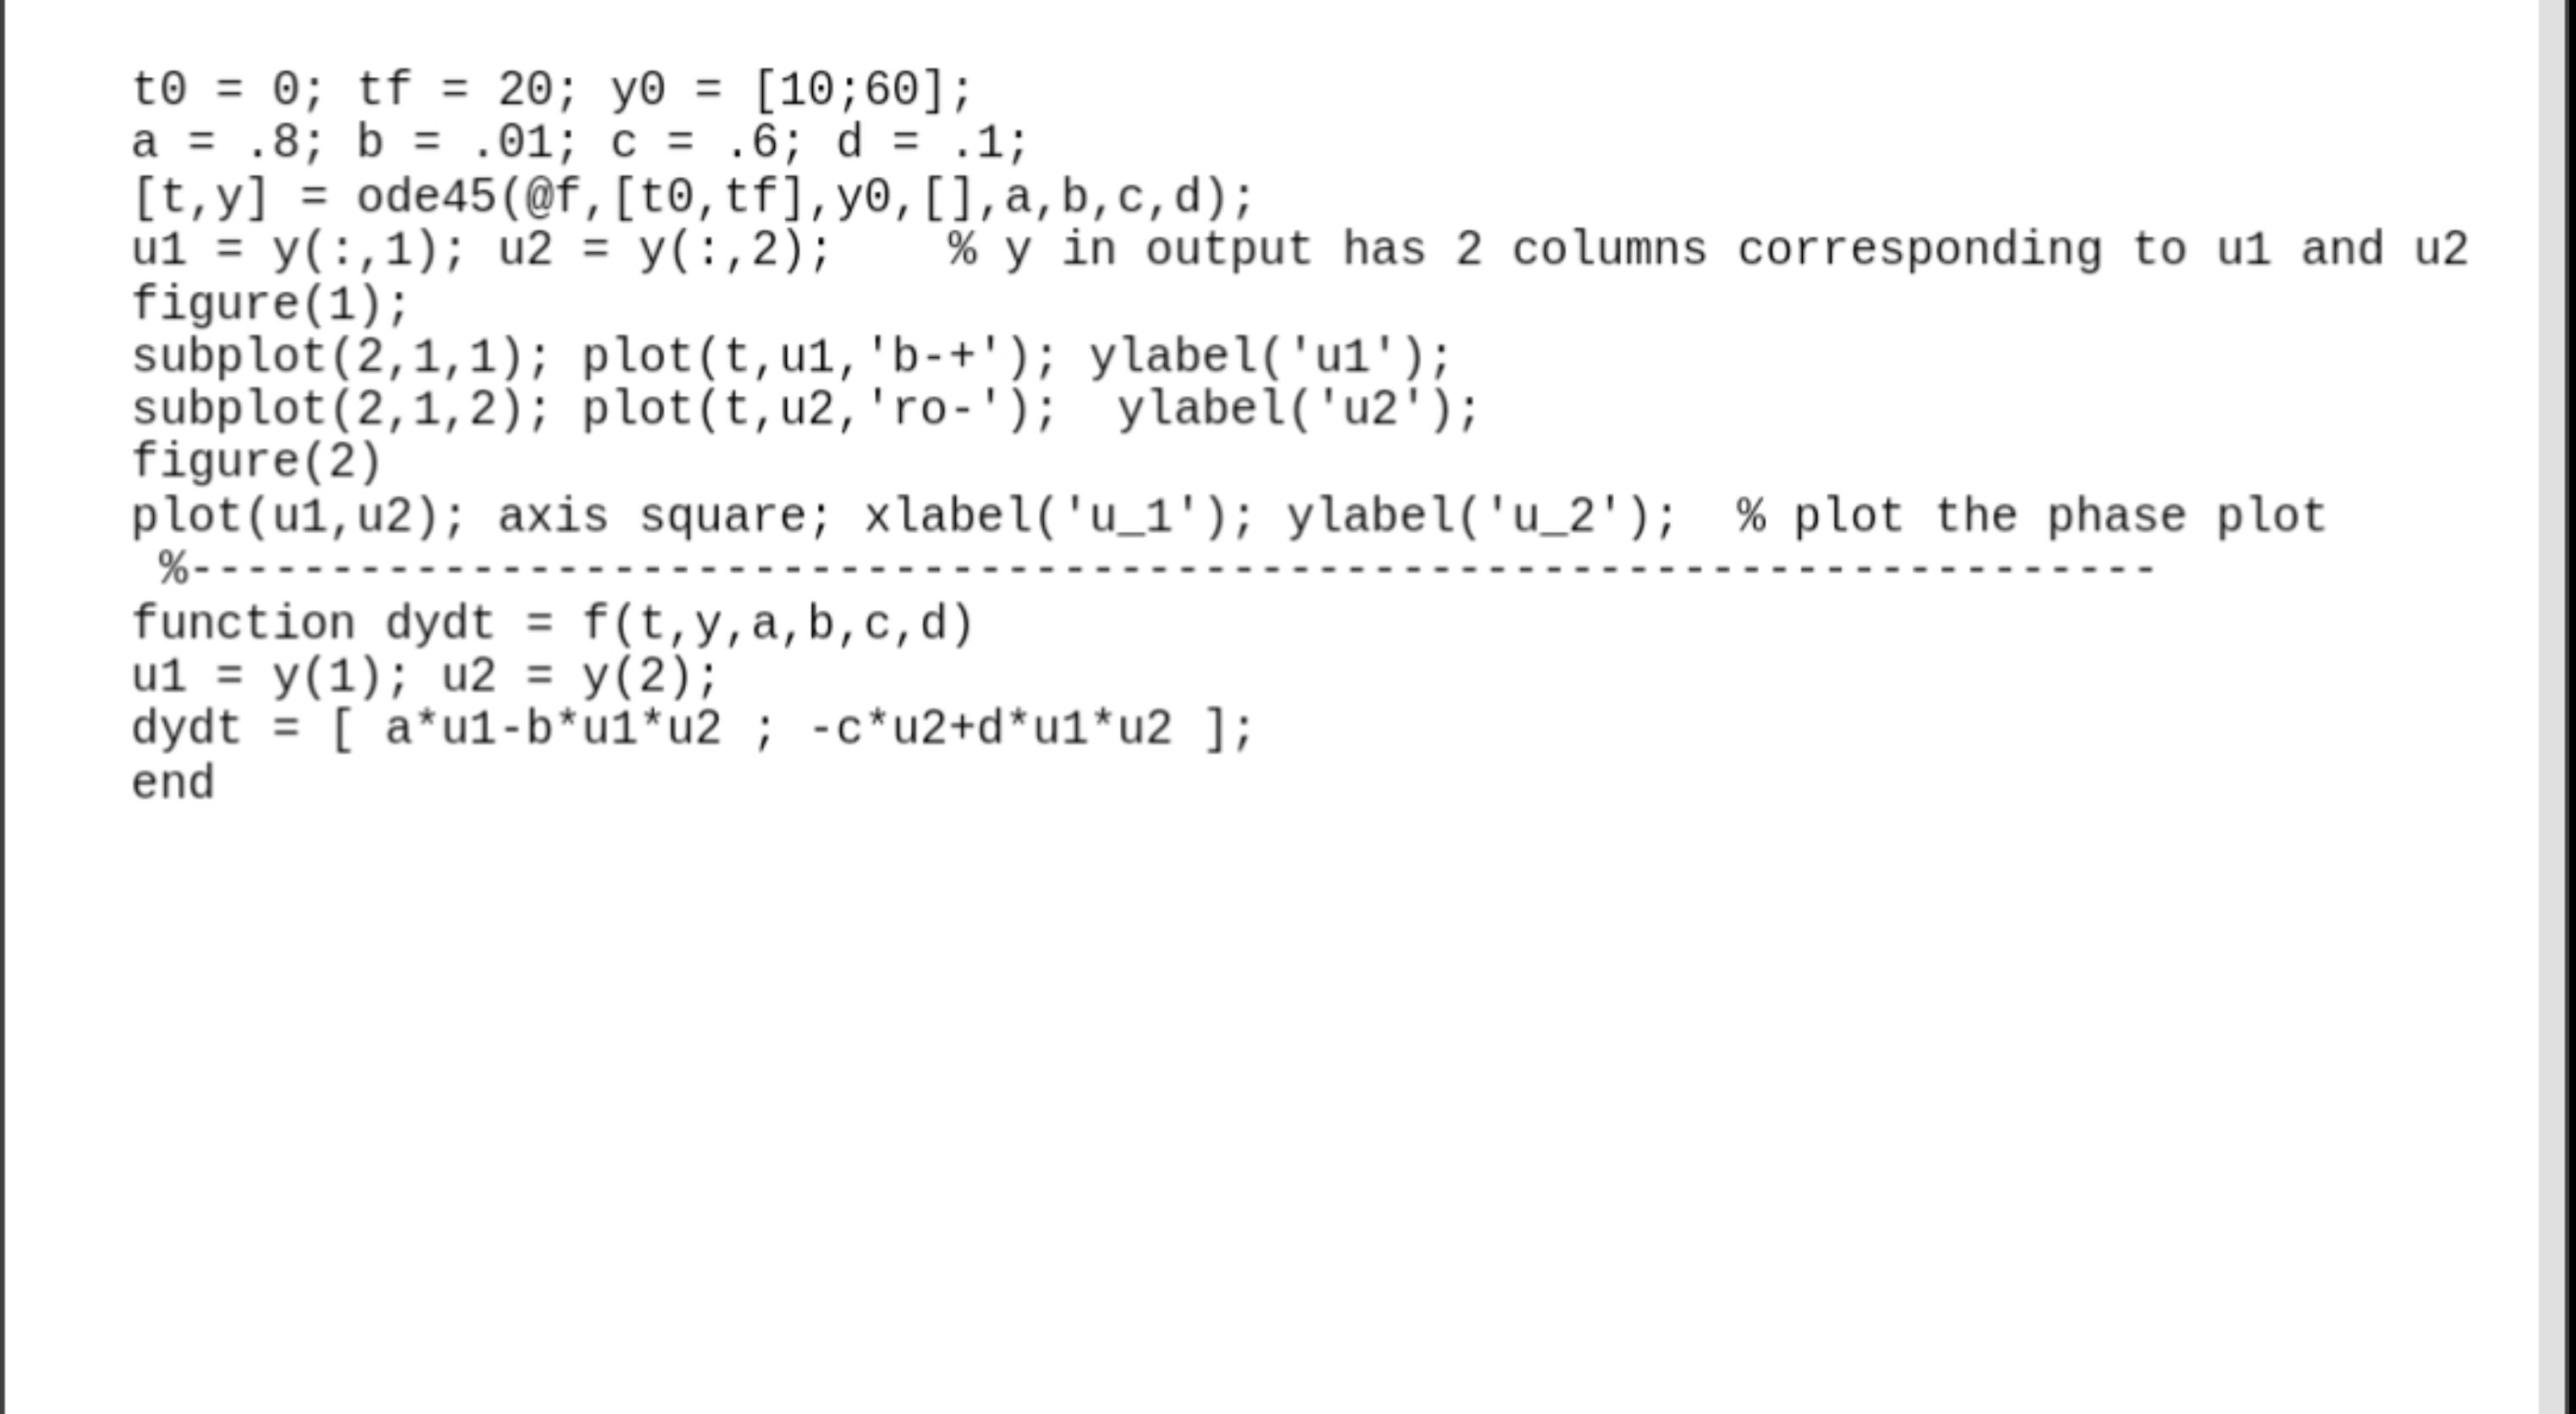
ode@;
:;:; y in output has columns corresponding to u and u
figure;
subplot ; plott ub; ylabelu;
subplot; plotturo; ylabelu;
figure
plotuu; axis square; xlabelu; ylabelu; plot the phase plot
function dydt
;;
dydt ;;
end
Step by Step Solution
There are 3 Steps involved in it
1 Expert Approved Answer
Step: 1 Unlock

Question Has Been Solved by an Expert!
Get step-by-step solutions from verified subject matter experts
Step: 2 Unlock
Step: 3 Unlock