

Question: Solve please and do graph Edit View History Bookmarks Tools Window Help gn In X MindTap - Cengage Learning X Logins & Passwords X https:/g.cengage.com/staticb/ui/evo/index.html?deploymentid=583264248

Solve please and do graph
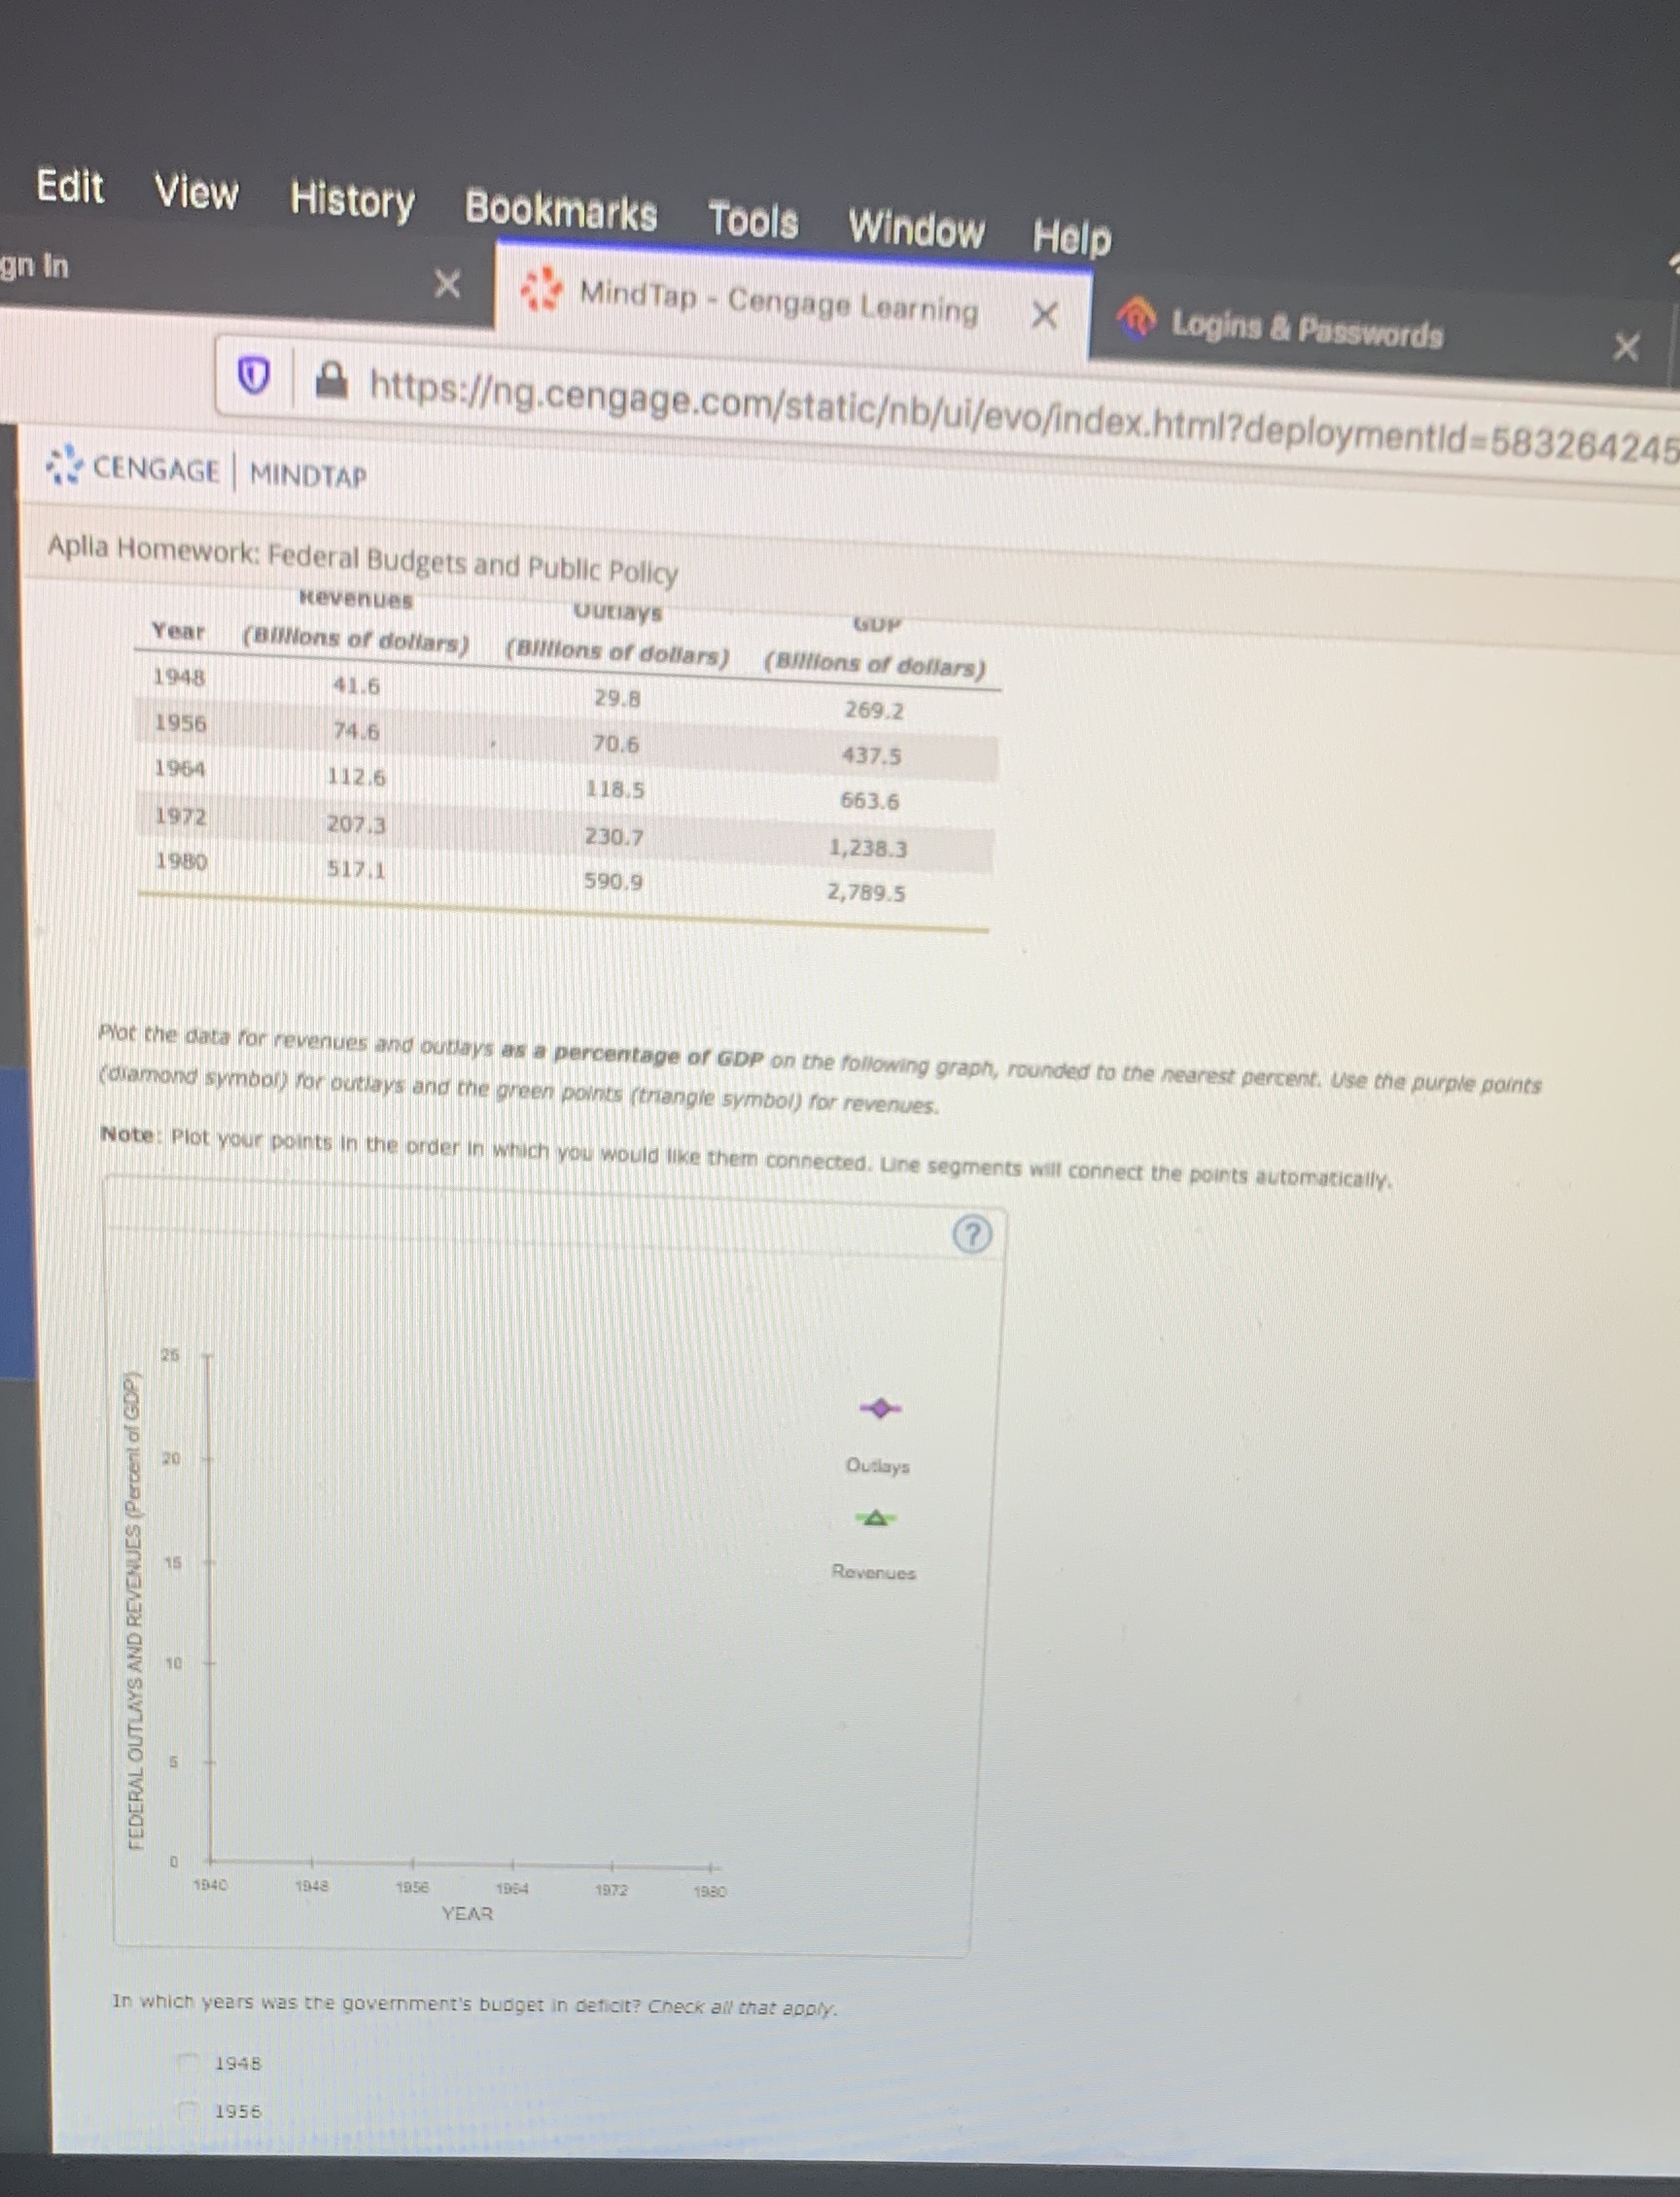
Edit View History Bookmarks Tools Window Help gn In X MindTap - Cengage Learning X Logins & Passwords X https:/g.cengage.com/staticb/ui/evo/index.html?deploymentid=583264248 CENGAGE | MINDTAP Aplia Homework: Federal Budgets and Public Policy Revenues Outlays GDP Year (Billions of dollars) (Billions of dollars) (Billions of dollars) 1948 41.6 29.8 269.2 1956 74.6 70.6 437.5 1964 1 12.6 1 185 663.6 1972 207.3 230.7 1,238.3 1980 517 1 590.9 2,789.5 Not the data for revenues and outlays as a percentage of GDP on the following graph, rounded to the nearest percent. Use the purple points (diamond symbol) for outlays and the green points (triangle symbol) for revenues. Note: Plot your points in the order in which you would like them connected. Line segments will connect the points automatically. Outlays 20 A Revenues FEDERAL OUTLAYS AND REVENUES (Percent of GDP) 10 1948 1954 1972 1980 YEAR In which years was the government's budget in deficit? Check all that apply. 1948 1956
Step by Step Solution
There are 3 Steps involved in it

Get step-by-step solutions from verified subject matter experts