

Question: solve please C D E F G H 1 Problem 2-9 See the table far below showing financial statement data and stock price data for
 solve please
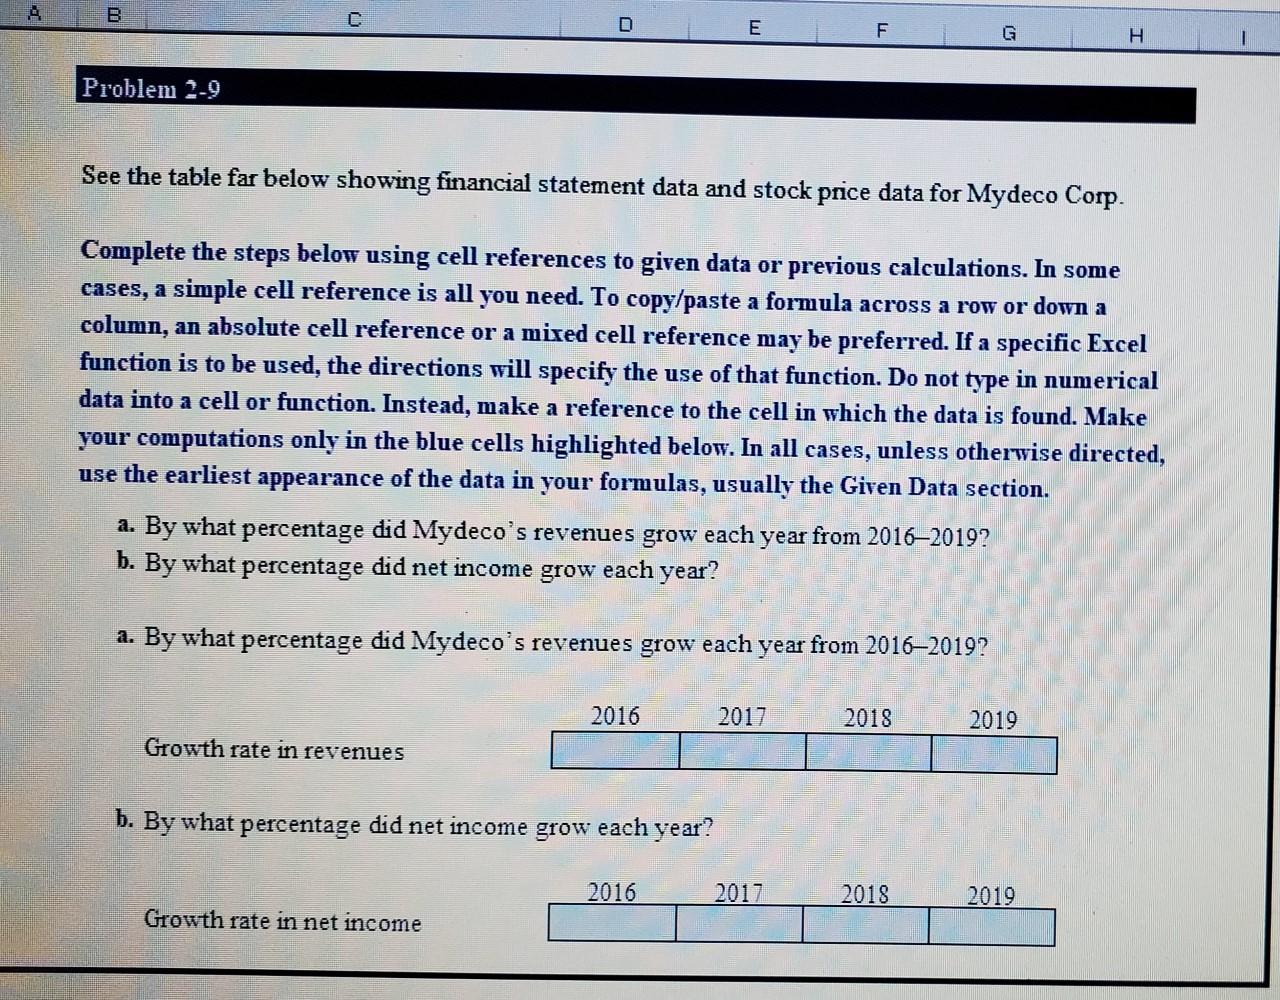
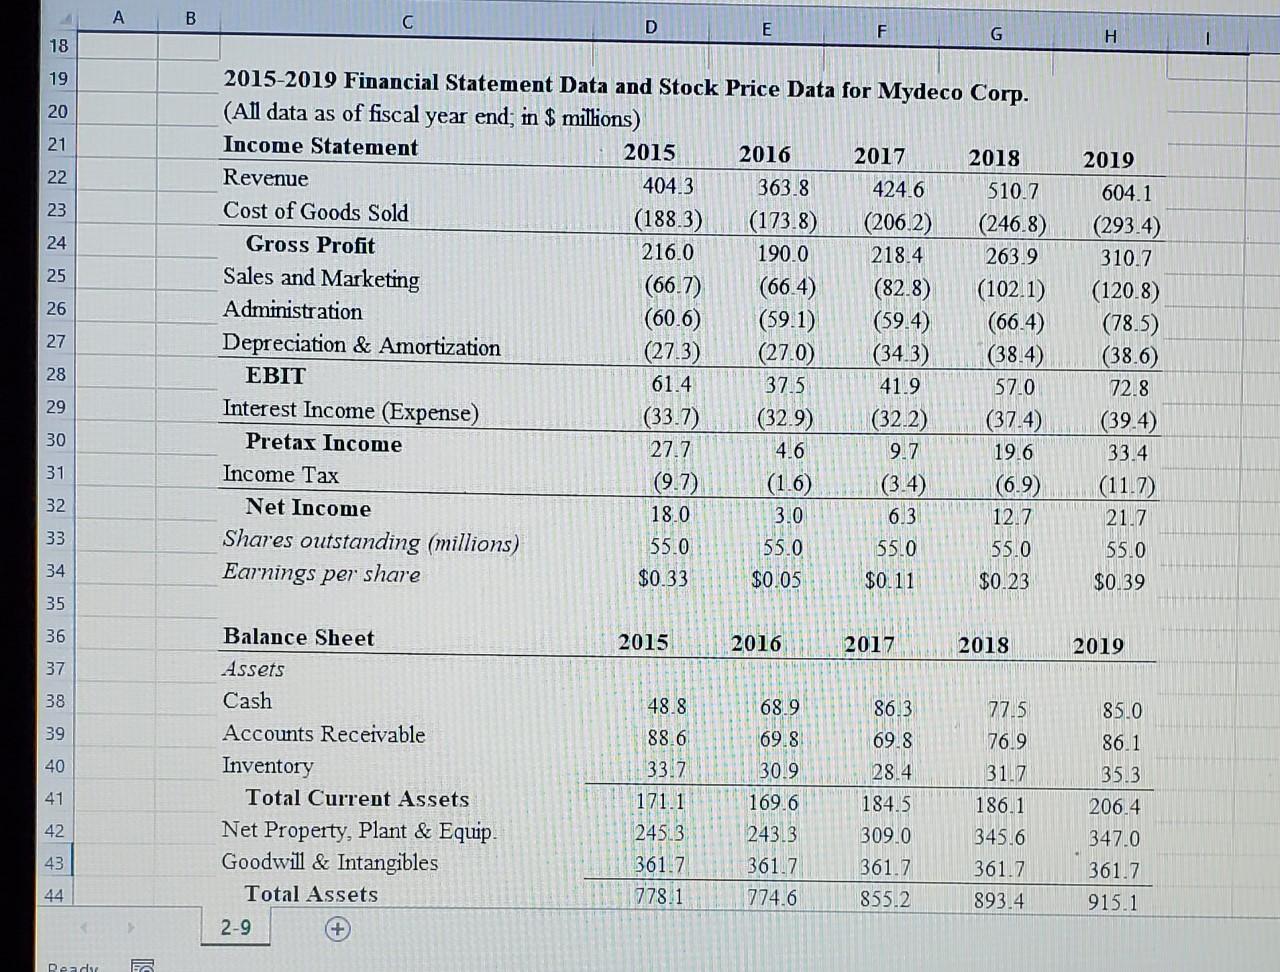
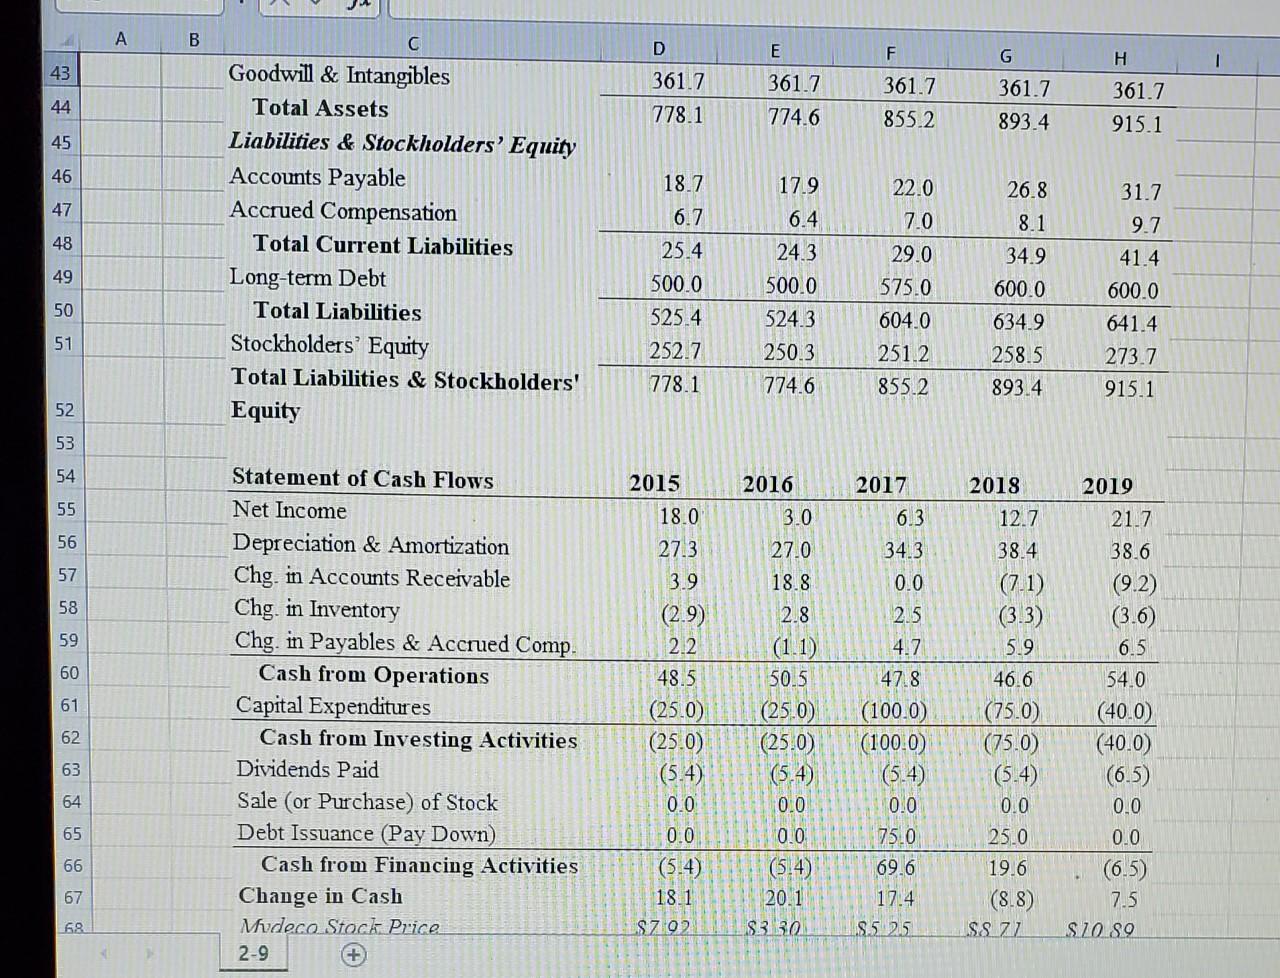
C D E F G H 1 Problem 2-9 See the table far below showing financial statement data and stock price data for Mydeco Corp. Complete the steps below using cell references to given data or previous calculations. In some cases, a simple cell reference is all you need. To copy/paste a formula across a row or down a column, an absolute cell reference or a mixed cell reference may be preferred. If a specific Excel function is to be used, the directions will specify the use of that function. Do not type in numerical data into a cell or function. Instead, make a reference to the cell in which the data is found. Make your computations only in the blue cells highlighted below. In all cases, unless otherwise directed, use the earliest appearance of the data in your formulas, usually the Given Data section. a. By what percentage did Mydeco's revenues grow each year from 20162019? b. By what percentage did net income grow each year? a. By what percentage did Mydeco's revenues grow each year from 2016-2019? 2016 2017 2018 2019 Growth rate in revenues b. By what percentage did net income grow each year? 2016 2017 2018 2019 Growth rate in net income B D E F G H 18 19 20 21 22 23 24 25 26 2015-2019 Financial Statement Data and Stock Price Data for Mydeco Corp. (All data as of fiscal year end; in $ millions) Income Statement 2015 2016 2017 2018 Revenue 404.3 363.8 424.6 510.7 Cost of Goods Sold (188.3) (173.8) (206.2) (246.8) Gross Profit 216.0 190.0 218.4 263.9 Sales and Marketing (66.7) (66.4) (82.8) (102.1) Administration (60.6) (59.1) (59.4) (66.4) Depreciation & Amortization (27.3) (27.0) (34.3) (38.4) EBIT 61.4 37.5 41.9 57.0 Interest Income (Expense) (33.7) (32.9) (32.2) (37.4) Pretax Income 27.7 4.6 9.7 19.6 Income Tax (9.7) (1.6) (3.4) (6.9) Net Income 18.0 3.0 6.3 12.7 Shares outstanding (millions) 55.0 55.0 55.0 Earnings per share $0.33 $0.05 $0.11 $0.23 27 28 2019 604.1 (293.4) 310.7 (120.8) (78.5) (38.6) 72.8 (39.4) 33.4 (11.7) 21.7 55.0 $0.39 29 30 31 32 33 55.0 34 35 36 2015 2016 2017 2018 2019 37 38 68.9 39 69.8 30.9 40 Balance Sheet Assets Cash Accounts Receivable Inventory Total Current Assets Net Property, Plant & Equip. Goodwill & Intangibles Total Assets 2-9 41 48.8 88.6 33.7 171.1 245.3 361.7 778.1 86.3 69.8 28.4 184.5 309.0 361.7 855.2 169.6 243.3 361.7 774.6 77.5 76.9 31.7 186.1 345.6 361.7 893.4 85.0 86.1 35.3 206.4 347.0 361.7 915.1 42 43 44 Readu FA A B D E F G H 43 361.7 778.1 361.7 774.6 44 361.7 855.2 361.7 893.4 361.7 915.1 45 46 31.7 47 9.7 48 Goodwill & Intangibles Total Assets Liabilities & Stockholders' Equity Accounts Payable Accrued Compensation Total Current Liabilities Long-term Debt Total Liabilities Stockholders' Equity Total Liabilities & Stockholders' Equity 49 18.7 6.7 25.4 500.0 525.4 252.7 778.1 17.9 6.4 24.3 500.0 524.3 250.3 774.6 22.0 7.0 29.0 575.0 604.0 251.2 855.2 26.8 8.1 34.9 600.0 634.9 258.5 893.4 41.4 600.0 50 51 641.4 273.7 915.1 52 53 54 55 2015 18.0 27.3 O O 2017 6.3 34.3 56 57 3.9 0.0 58 59 60 61 Statement of Cash Flows Net Income Depreciation & Amortization Chg in Accounts Receivable Chg in Inventory Chg. in Payables & Accrued Comp. Cash from Operations Capital Expenditures Cash from Investing Activities Dividends Paid Sale (or Purchase) of Stock Debt Issuance (Pay Down) Cash from Financing Activities Change in Cash Mudeco Stock Price 2-9 + 2016 3.0 27.0 18.8 2.8 (1.1) 50.5 (25.0) (25.0) (5.4) 0.0 0.0 (5.4) 20.1 $330 (2.9) 2.2 48.5 (25.0 (25.0) (5.4) 0.0 0.0 (5.4) 18.1 SZ02 2018 12.7 38.4 (7.1) (3.3) 5.9 46.6 (75.0) (75.0) (5.4) 0.0 25.0 19.6 (8.8) SS ZZ 62 2019 21.7 38.6 (9.2) (3.6) 6.5 54.0 (400) (40.0) (6.5) 0.0 0.0 (6.5) 7.5 SZO.89 2.5 4.7 47.8 (100.0) (100.0 (5.4) 0.0 75.0 69.6 17.4 .8.5 2.5 63 64 65 66 67 68 A B D E F H 60 J 61 62 63 Cash from Operations Capital Expenditures Cash from Investing Activities Dividends Paid Sale (or Purchase) of Stock Debt Issuance (Pay Down) Cash from Financing Activities Change in Cash Mydeco Stock Price 64 48.5 (25.0) (25.0) (5.4) 0.0 0.0 (5.4) 18.1 $7.92 50.5 (25.0) (25.0) (5.4) 0.0 0.0 (5.4) 20.1 $3.30 47.8 (100.0) (100.0) (5.4) 0.0 75.0 69.6 17.4 $5.25 G 46.6 (750) (75.0) (5.4) 0.0 25.0 19.6 (8.8) $8.71 54.0 (40.0) (40.0) (6.5) 0.0 0.0 (6.5) 7.5 $10.89 65 66 67 68 69 73 70 71 Requirements 72 1. Start Excel - completed. In cell D11, by using cell references, calculate the growth rate in revenues for 2016 (1 pt.). 3. To calculate the growth rate in revenues for 2017-2019, copy cell Dll and paste it onto cells 74 Ell:G11 (1 pt.) 75 4. In cell D16, by using cell references, calculate the growth rate in net income for 2016 (1 pt.) 5. To calculate the growth rate in net income for 2017-2019, copy cell D16 and paste it onto cells E16:516 (1 pt.) 77 6. Save the workbook Close the workbook and then exit Excel. Submit the workbook as directed 76 78 79 80 81 82 83 84 85 86 2-9
Step by Step Solution
There are 3 Steps involved in it

Get step-by-step solutions from verified subject matter experts