

Question: solve please The graph illustrates a normal distribution for the prices paid for a particular model of HD television. The mean price paid is $1200
solve please
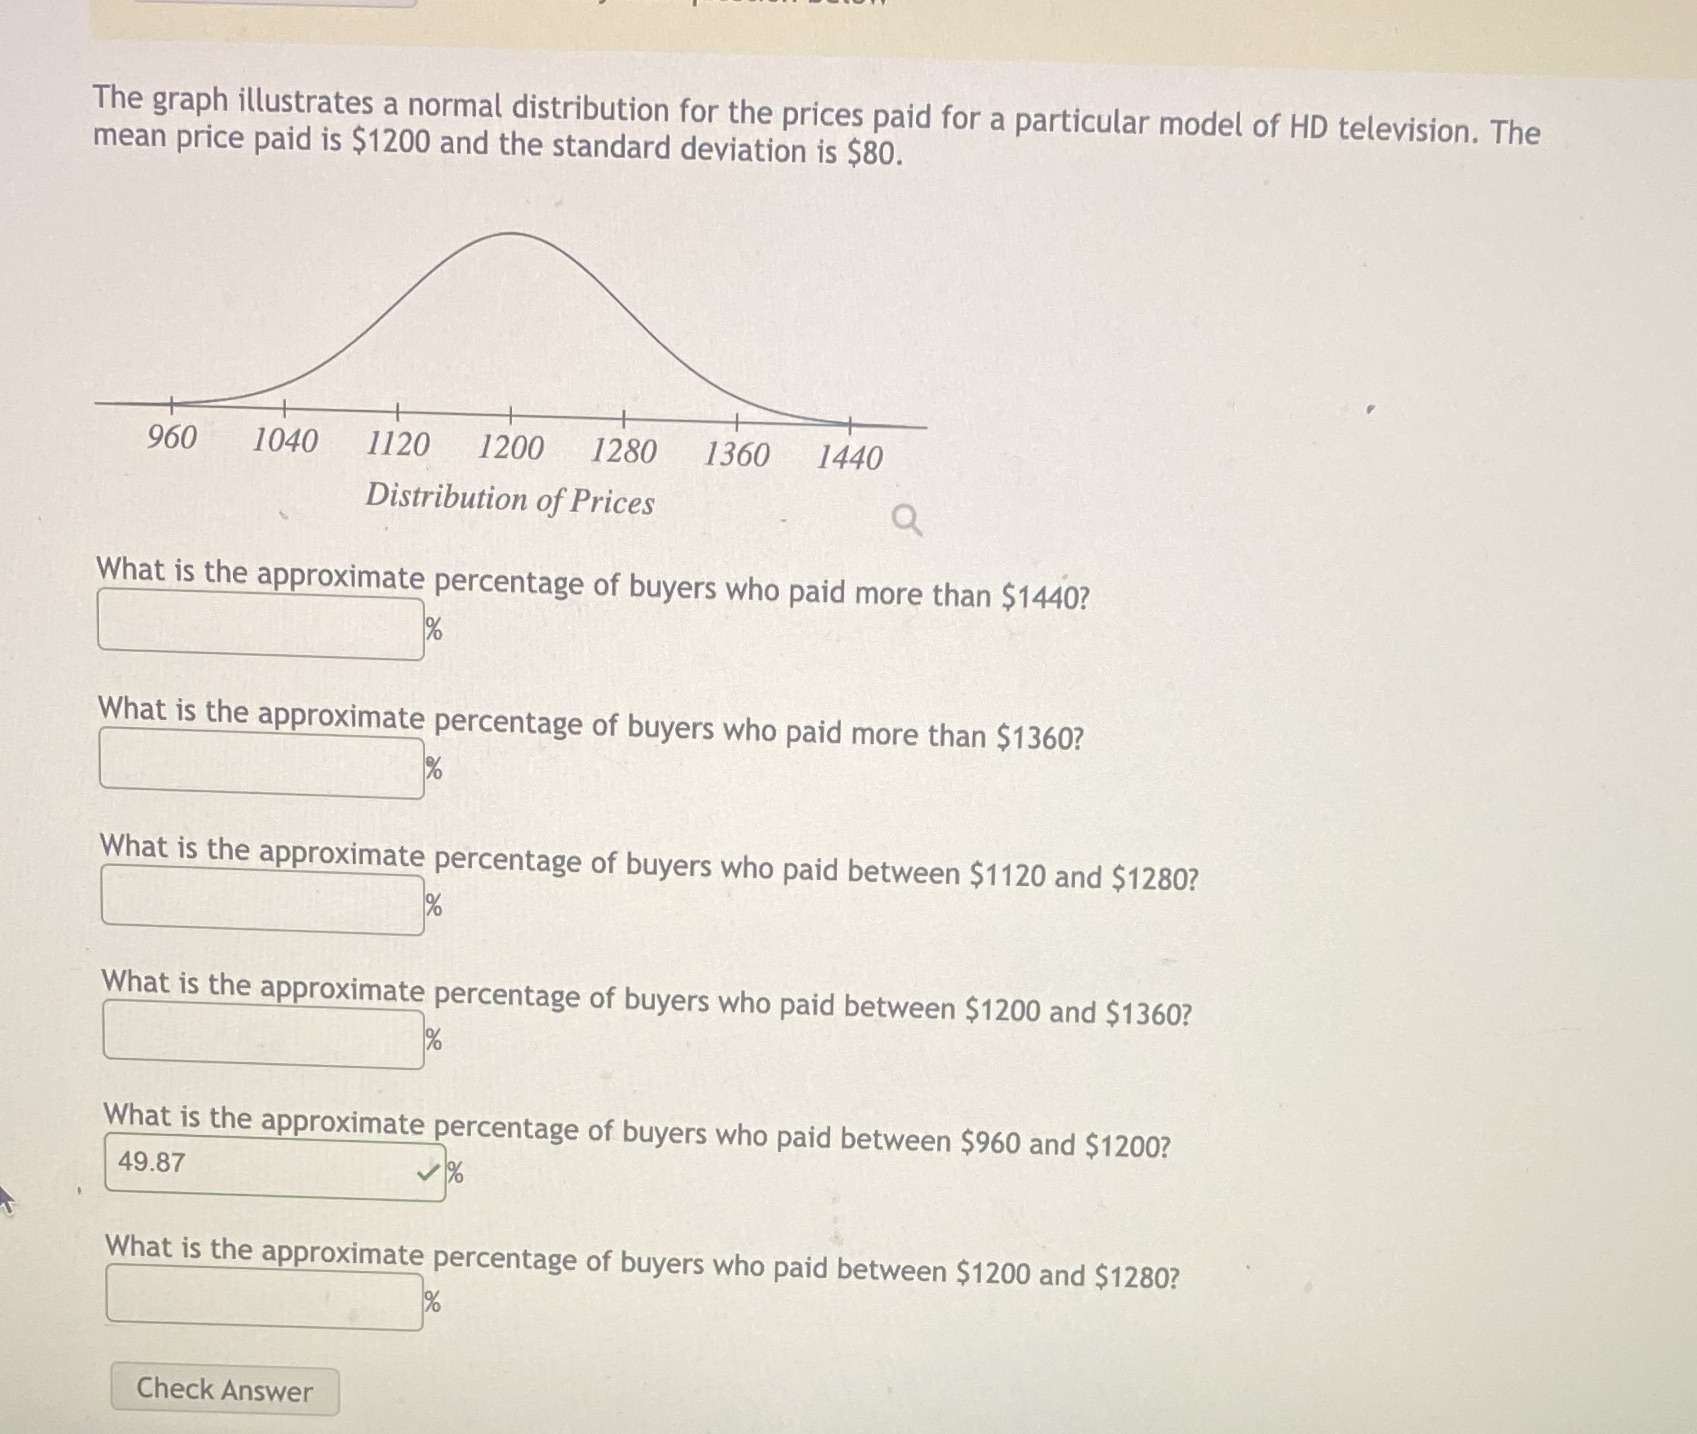
The graph illustrates a normal distribution for the prices paid for a particular model of HD television. The mean price paid is $1200 and the standard deviation is $80. 960 1040 1120 1200 1280 1360 1440 Distribution of Prices Q What is the approximate percentage of buyers who paid more than $1440? What is the approximate percentage of buyers who paid more than $1360? What is the approximate percentage of buyers who paid between $1120 and $1280? What is the approximate percentage of buyers who paid between $1200 and $1360? What is the approximate percentage of buyers who paid between $960 and $1200? 49.87 % What is the approximate percentage of buyers who paid between $1200 and $1280? Check
Step by Step Solution
There are 3 Steps involved in it

Get step-by-step solutions from verified subject matter experts