

Question: Solve please X MindTap - Cengage Learning X + https:/g.cengage.com/staticb/ui/evo/index.html?deploymentld=58326424512456945640 CENGAGE MINDTAP Aplia Homework: Monetary Theory and Policy Attempts Average / 3 2. Equilibrium and
Solve please
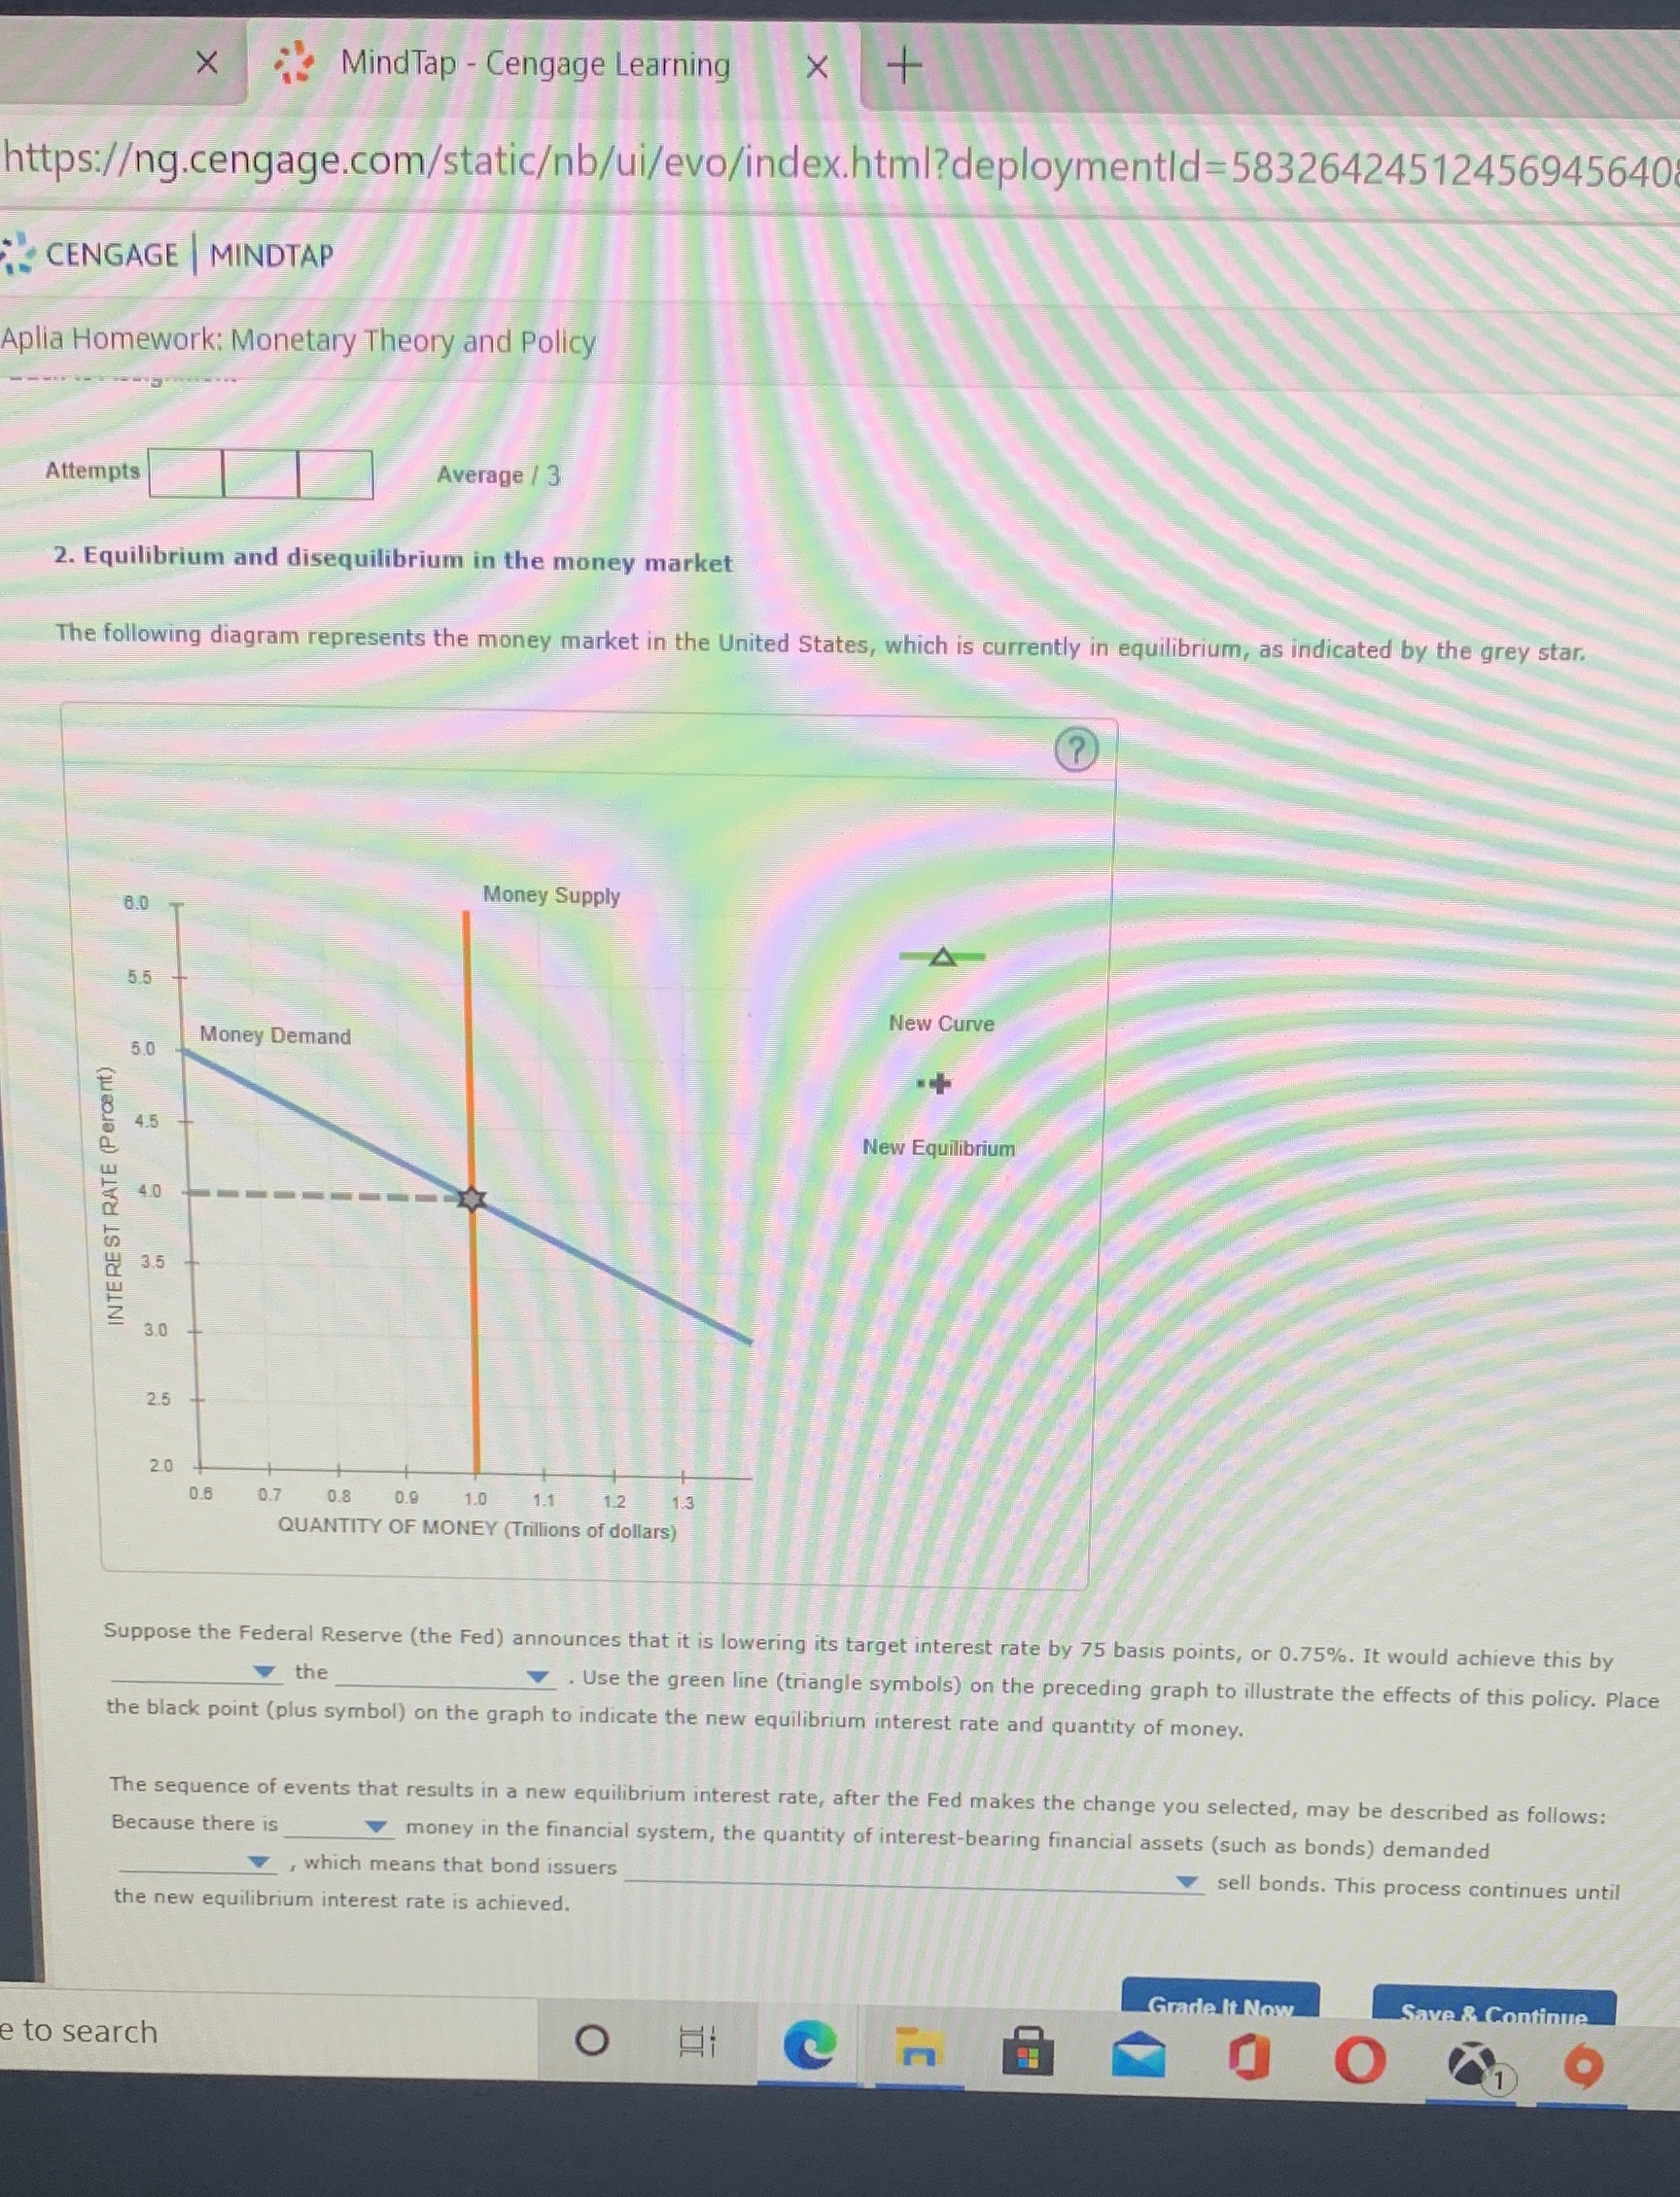
X MindTap - Cengage Learning X + https:/g.cengage.com/staticb/ui/evo/index.html?deploymentld=58326424512456945640 CENGAGE MINDTAP Aplia Homework: Monetary Theory and Policy Attempts Average / 3 2. Equilibrium and disequilibrium in the money market The following diagram represents the money market in the United States, which is currently in equilibrium, as indicated by the grey star, Money Supply 8.0 A 5.5 New Curve Money Demand 5.0 4.5 New Equilibrium 4.0 INTEREST RATE (Percent) 3.5 3.0 20 0.6 0.7 0.8 0.9 1.1 1.2 QUANTITY OF MONEY (Trillions of dollars) Suppose the Federal Reserve (the Fed) announces that it is lowering its target interest rate by 75 basis points, or 0.75%. It would achieve this by the . Use the green line (triangle symbols) on the preceding graph to illustrate the effects of this policy. Place the black point (plus symbol) on the graph to indicate the new equilibrium interest rate and quantity of money. The sequence of events that results in a new equilibrium interest rate, after the Fed makes the change you selected, may be described as follows: Because there is_ money in the financial system, the quantity of interest-bearing financial assets (such as bonds) demanded , which means that bond issuers sell bonds. This process continues until the new equilibrium interest rate is achieved. Grade It Now Save & Continue e to search O n
Step by Step Solution
There are 3 Steps involved in it

Get step-by-step solutions from verified subject matter experts