

Question: Solve Problem 4.9 (given below). In addition, compute the EMV and Standard Deviation for each strategy and interpret the findings. a) (15 points) Solve first
Solve Problem 4.9 (given below). In addition, compute the
EMV and Standard Deviation for each strategy and interpret the findings.
a) (15 points) Solve first without the Precision Tree software
b) (15 points) Solve using Precision Tree (Hint 1: To get a risk profile for each strategy, you
need to draw the decision tree for each strategy separately. Hint 2: right click on the initial starting node (on the most left) and select decision analysis => risk profile) 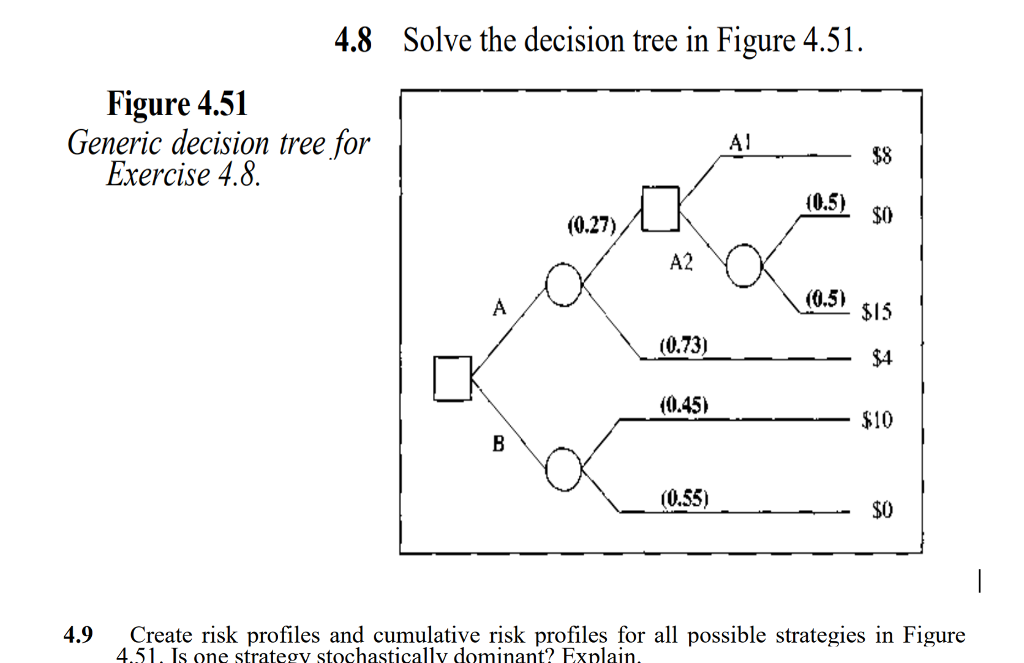
4.8 Solve the decision tree in Figure 4.51 Figure 4.51 Generic decision tree for $8 Exercise 4.8 0.5) $0 (0.27) A2 (0.5) %15 $4 $10 (0.73) (0.45) (0.55) SO 4.9Create risk profiles and cumulative risk profiles for all possible strategies in Figure 451. Is one strategy stochasticallv dominant? Exnlain 4.8 Solve the decision tree in Figure 4.51 Figure 4.51 Generic decision tree for $8 Exercise 4.8 0.5) $0 (0.27) A2 (0.5) %15 $4 $10 (0.73) (0.45) (0.55) SO 4.9Create risk profiles and cumulative risk profiles for all possible strategies in Figure 451. Is one strategy stochasticallv dominant? Exnlain
Step by Step Solution
There are 3 Steps involved in it

Get step-by-step solutions from verified subject matter experts