

Question: solve problems please 3) The following data represents the course load in credit hours of 32 students: 3, 3, 4, 6, 6, 8, 9, 9,
solve problems please
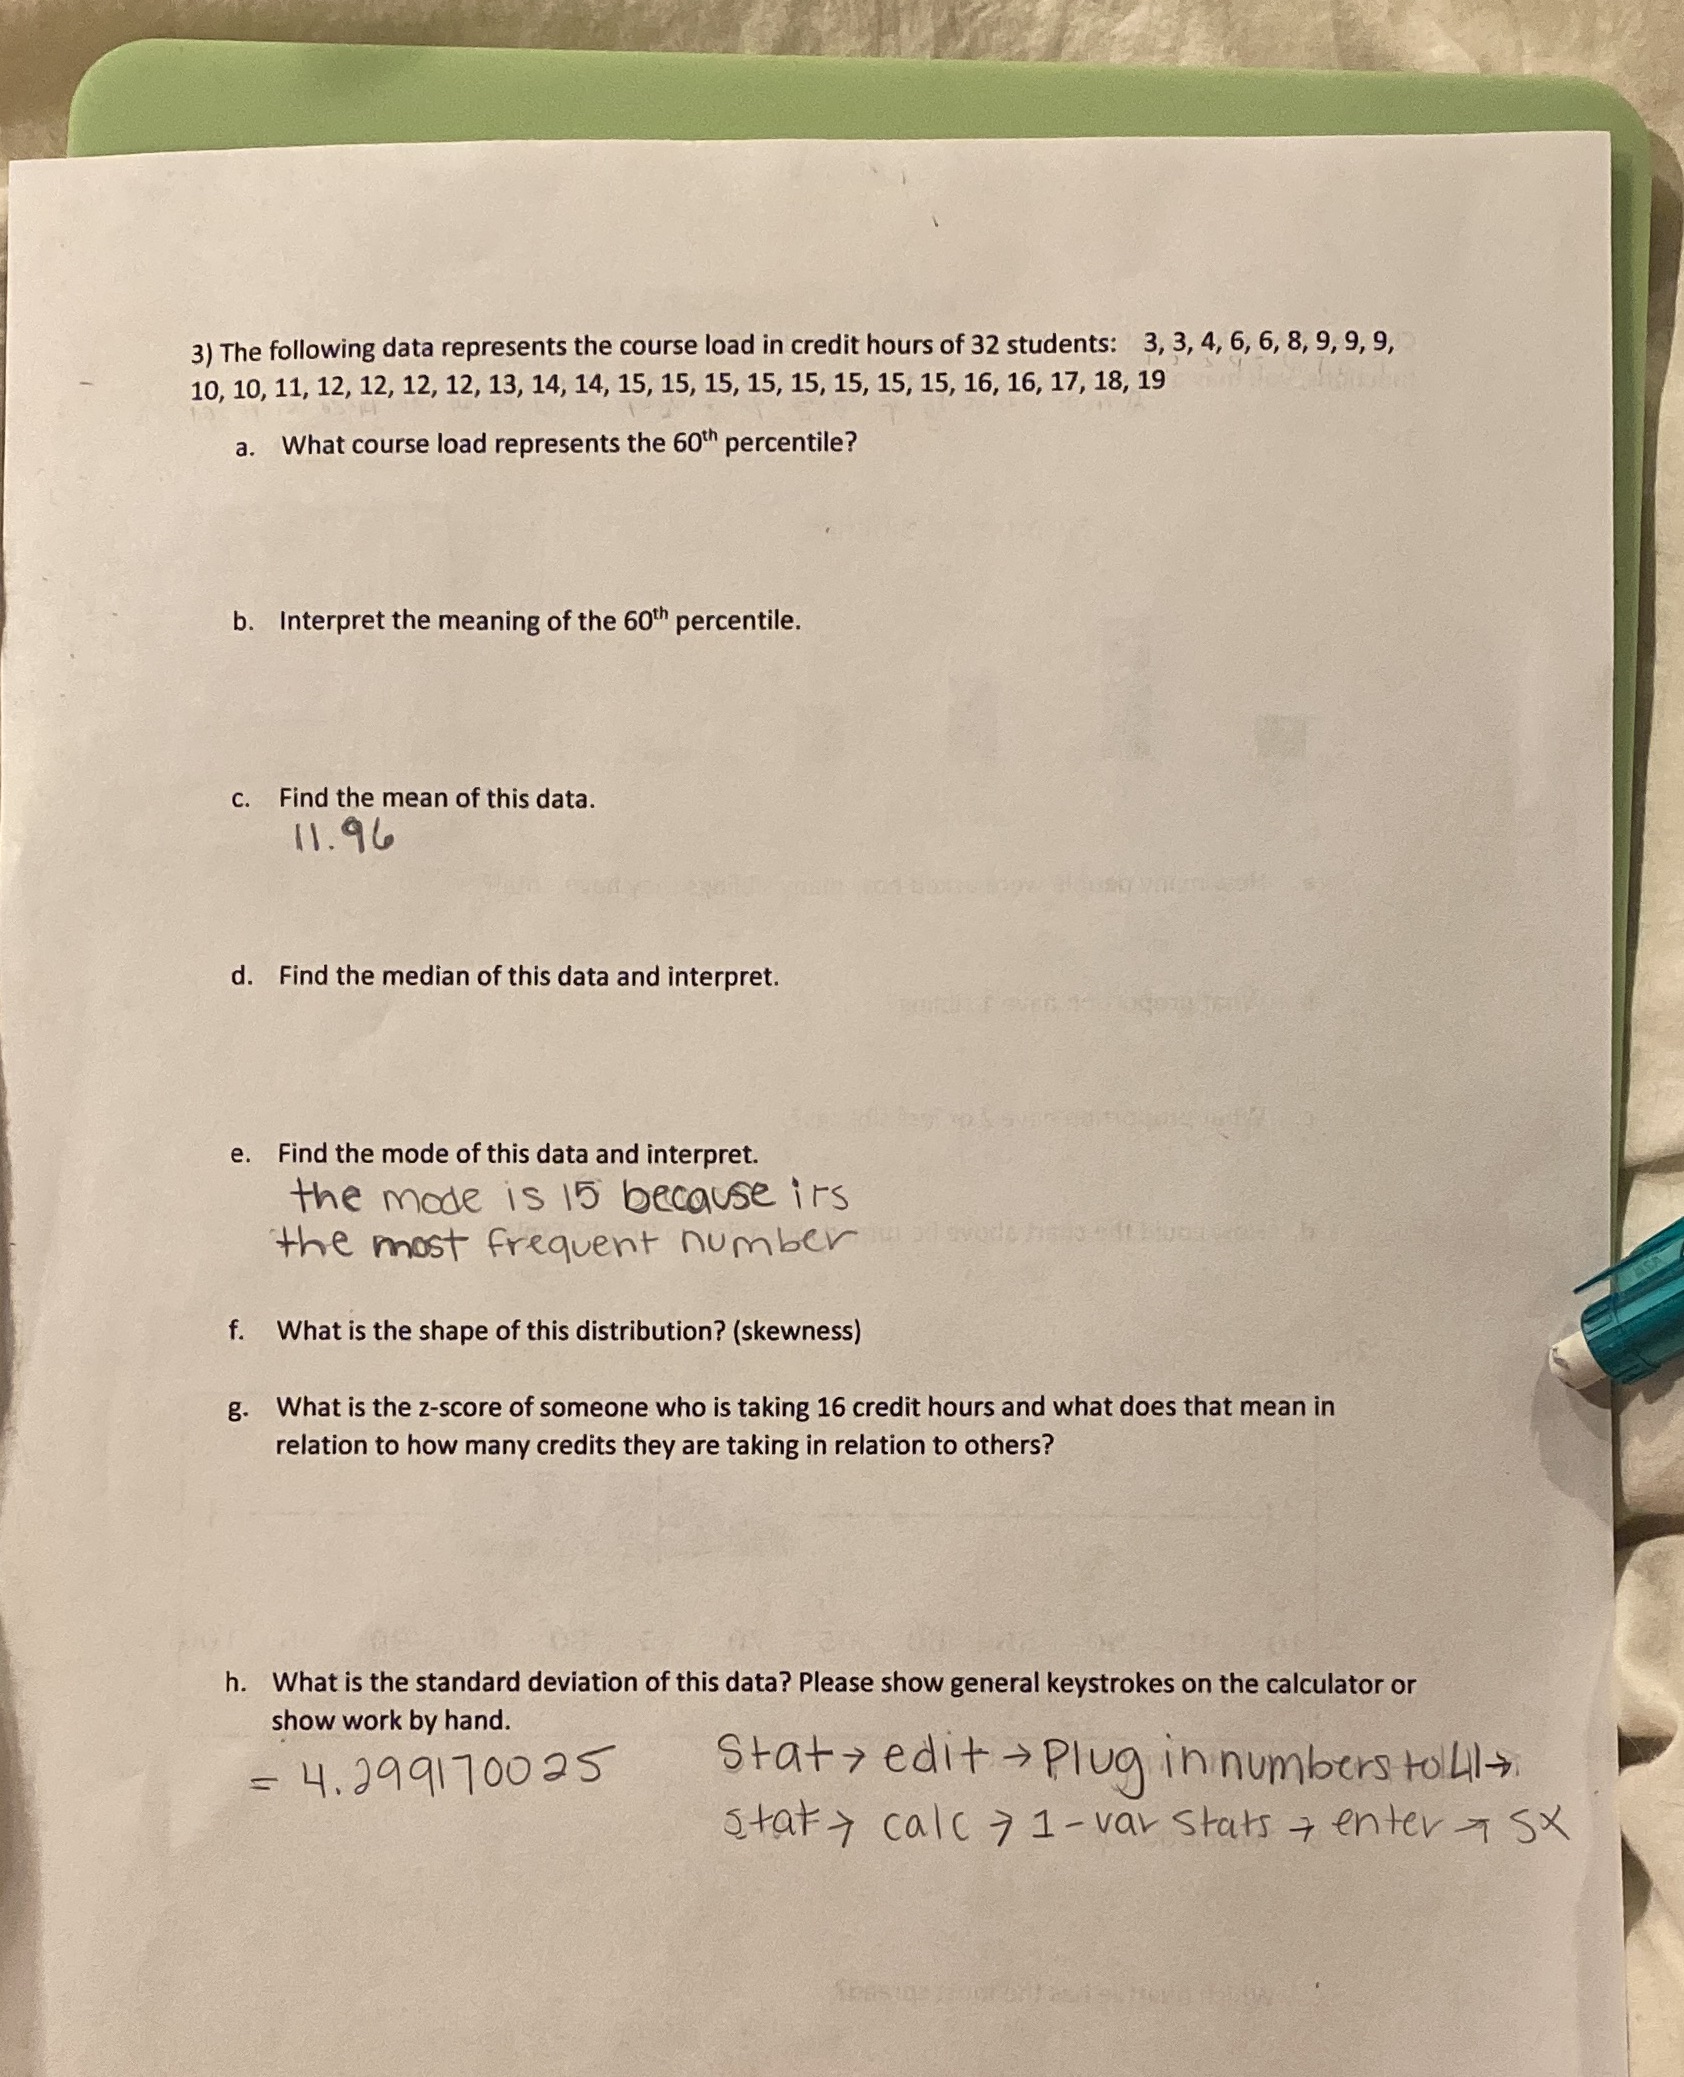
3) The following data represents the course load in credit hours of 32 students: 3, 3, 4, 6, 6, 8, 9, 9, 9, 10, 10, 11, 12, 12, 12, 12, 13, 14, 14, 15, 15, 15, 15, 15, 15, 15, 15, 16, 16, 17, 18, 19 a. What course load represents the 60th percentile? b. Interpret the meaning of the 60th percentile. c. Find the mean of this data. 11. 96 d. Find the median of this data and interpret. e. Find the mode of this data and interpret. the mode is 15 because its the most frequent number f. What is the shape of this distribution? (skewness) g. What is the z-score of someone who is taking 16 credit hours and what does that mean in relation to how many credits they are taking in relation to others? What is the standard deviation of this data? Please show general keystrokes on the calculator or show work by hand. = 4.299170025 Stat - edit - Plug in numbers toll- staff call 7 1 - var stats + enter sx
Step by Step Solution
There are 3 Steps involved in it

Get step-by-step solutions from verified subject matter experts