

Question: Solve Project A using the MACRS-ADS straight line depreciation method (same number of years) and compare the results with the MACRS-GDS solution. Compare the payback
Solve Project A using the MACRS-ADS straight line depreciation method (same number of years) and compare the results with the MACRS-GDS solution. Compare the payback periods the PW values of the profits and cash flows at 0% and 15% return.
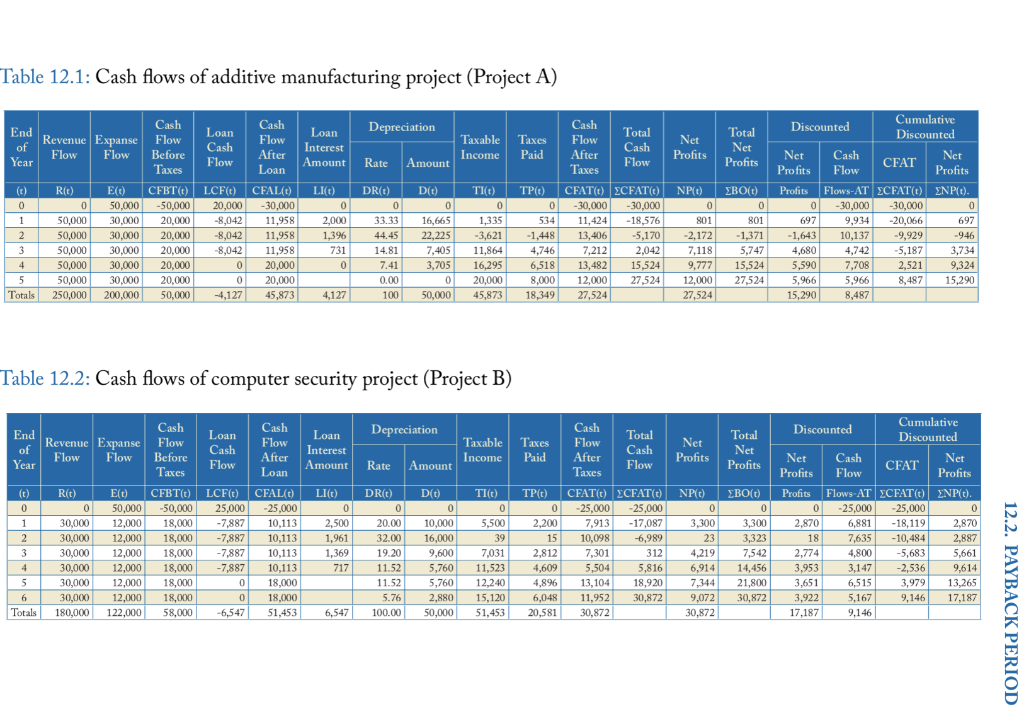
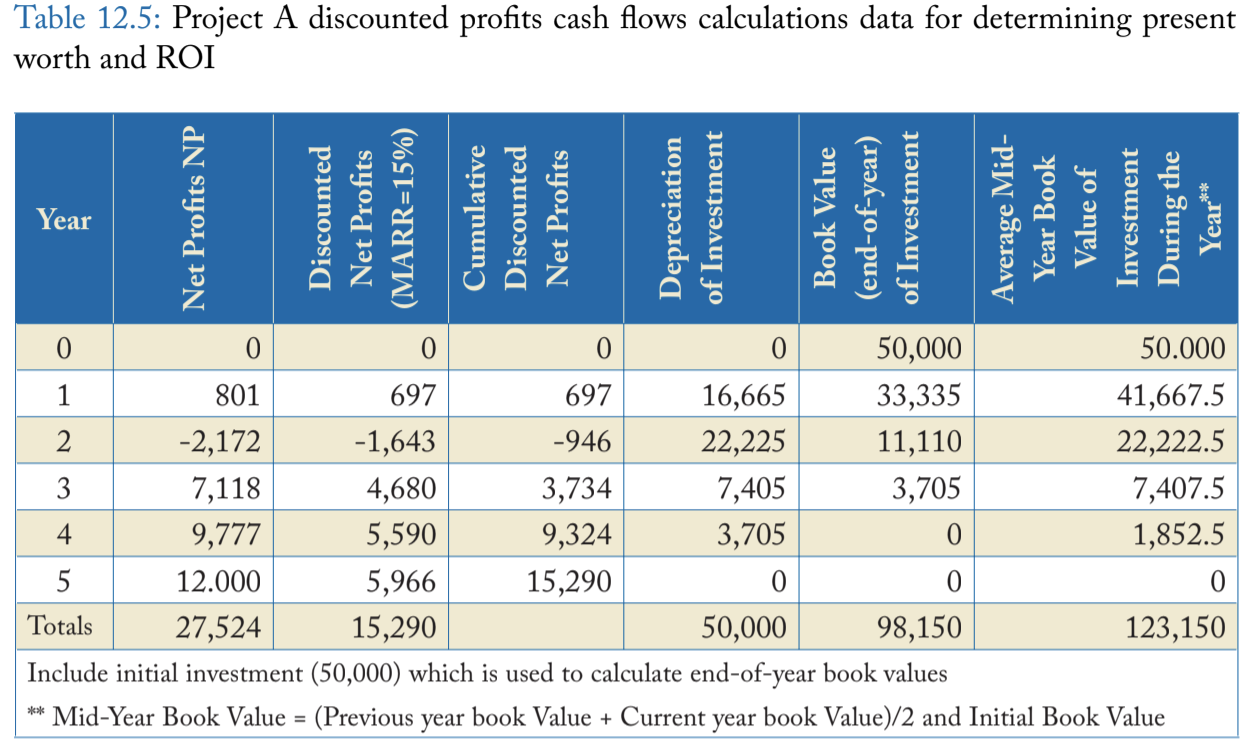
Solve Project A using the MACRS-ADS straight line depreciation method (same number of years) and compare the results with the MACRS-GDS solution. Compare the payback periods the PW values of the profits and cash flows at 0% and 15% return. Table 12.1: Cash flows of additive manufacturing project (Project A) Depreciation Revenue Expanse Flow Flow Loan Interest Amount Taxable Income Taxes Paid Total Cash Net Profits Rate Amount Flow Profits (0) LI(C) 0 0 Cash Loan Flow Before Cash Flow Taxes CFBT(0) LCF(0) -50,000 20,000 20,000 -8,042 20,000 -8,042 20,000 -8,042 20,000 0 20,000 0 50,000 4,127 Rt) 0 5 0,000 50,000 50,000 50,000 50,000 250,000 Cash Flow After Loan CFALO -30,000 11,958 1 1,958 11,958 20,000 20,000 45,873 Et) 50,000 30,000 30,000 30,000 30,000 30,000 200,000 1 2 Cash Flow After Taxes CEAT(0) -30,000 11,424 13,406 7,212 13,482 12,000 27,524 DR(0) Du) 0 33.33 16,665 44.45 22,225 14.817 ,405 7.413 ,705 0.00 0 100 50,000 TIC) 0 1,335 -3,621 11,864 16,295 20,000 45,873 2,000 1,396 731 0 Cumulative Total Discounted Discounted Net Net Cash Net Profits Flow CFAT Profits BOC) Profits Flows-AT CEAT(C) ENPO). 0 0 -30,000 -30,000 0 801 697 9 ,934 -20,066 697 -1,371 -1,643 10,137 -9,929 -946 5,7474 ,680 4,742 -5,187 3 ,734 15,524 5,590 7,708 2,521 9,324 27,524 5,9665 ,9668 ,487 15,290 15,290 8,487 TPC) 0 5 34 -1,448 4 ,746 6,518 8,000 18,349 CFATONPO) -30,000 0 -18,576 801 -5,170 -2,172 2,042 7,118 15,524 9,777 27,524 12,000 27,524 3 4 500 5 Totals 4,127 Table 12.2: Cash flows of computer security project (Project B) Depreciation End of Year Revenue Expanse Flow Flow Cash Flow Before Loan Cash Flow Cash Flow After Loan Interest Amount Taxable Income Taxes Paid Cash Flow After Total Cash Flow Net Profits Total Net Profits Taxes Loan Rate Amount Taxes Profits (t) 0 R/t) 0 30,000 30,000 30,000 30,000 30,000 30,000 180,000 E( D C FBT(0) 50,000 50,000 12,000 18,000 12,000 18,000 12,000 18,000 12,000 18,000 12,000 18,000 12,000 18,000 122,000 58,000 LCF) 25,000 -7,887 -7,887 -7,887 -7,887 0 0 -6,547 CFAL(C) -25,000 10,113 10,113 10,113 10,113 18,000 18,000 51,453 LI(C) 0 2,500 1,961 1.369 717 DR(t) 0 20.00 32.00 19.20 11.52 11.52 5.76 100.00 D(E) 0 10,000 16,000 9,600 5,760 5,760 2,880 50,000 TI(C) 0 5,500 39 7,031 11,523 12,240 15,120 51,453 TP(t) 0 2,200 15 2,812 4,609 4,896 6,048 20,581 CFAT(6) ECFATO -25,000 -25,000 7 ,913 -17,087 10,098 -6,989 7.301 312 5,504 5,816 13,104 1 8,920 11,952 30,872 30,872 NPC) 0 3,300 23 4,219 6 ,914 7,344 9,072 30,872 BO(C) 0 3,300 3,323 7,542 14,456 21,800 30,872 Cumulative Discounted Discounted Net Cash Net CFAT Profits Flow Profits Flows-AT ZCFAT(t) ENP(t). 0 -25,000 -25,000 2 ,870 6 ,881 -18,1192 ,870 18 7,635 -10,484 2.887 2,774 4.800 -5,683 5,661 3,953 3,147 -2,536 3,651 6,515 3,979 13,265 3,922 5,167 9,146 17,187 17,187 9,146 9,614 12.2. PAYBACK PERIOD Totals 6,547 Table 12.5: Project A discounted profits cash flows calculations data for determining present worth and ROI Year Net Profits NP Discounted Net Profits (MARR=15%) Cumulative Discounted Net Profits Depreciation of Investment Book Value (end-of-year) of Investment Average Mid- Year Book Value of Investment During the Year** 50,000 50.000 801 697 697 16,665 33,335 41,667.5 -2,172 -1,643 -946 22,225 11,110 22,222.5 7,118 4,680 3,734 7,405 3,705 7,407.5 4 9,777 5,590 9,324 3,705 0 1,852.5 5 12.000 5,966 15,290 0 0 Totals 27,524 15,290 50,000 98,150 123,150 Include initial investment (50,000) which is used to calculate end-of-year book values ** Mid-Year Book Value = (Previous year book Value + Current year book Value)/2 and Initial Book Value Solve Project A using the MACRS-ADS straight line depreciation method (same number of years) and compare the results with the MACRS-GDS solution. Compare the payback periods the PW values of the profits and cash flows at 0% and 15% return. Table 12.1: Cash flows of additive manufacturing project (Project A) Depreciation Revenue Expanse Flow Flow Loan Interest Amount Taxable Income Taxes Paid Total Cash Net Profits Rate Amount Flow Profits (0) LI(C) 0 0 Cash Loan Flow Before Cash Flow Taxes CFBT(0) LCF(0) -50,000 20,000 20,000 -8,042 20,000 -8,042 20,000 -8,042 20,000 0 20,000 0 50,000 4,127 Rt) 0 5 0,000 50,000 50,000 50,000 50,000 250,000 Cash Flow After Loan CFALO -30,000 11,958 1 1,958 11,958 20,000 20,000 45,873 Et) 50,000 30,000 30,000 30,000 30,000 30,000 200,000 1 2 Cash Flow After Taxes CEAT(0) -30,000 11,424 13,406 7,212 13,482 12,000 27,524 DR(0) Du) 0 33.33 16,665 44.45 22,225 14.817 ,405 7.413 ,705 0.00 0 100 50,000 TIC) 0 1,335 -3,621 11,864 16,295 20,000 45,873 2,000 1,396 731 0 Cumulative Total Discounted Discounted Net Net Cash Net Profits Flow CFAT Profits BOC) Profits Flows-AT CEAT(C) ENPO). 0 0 -30,000 -30,000 0 801 697 9 ,934 -20,066 697 -1,371 -1,643 10,137 -9,929 -946 5,7474 ,680 4,742 -5,187 3 ,734 15,524 5,590 7,708 2,521 9,324 27,524 5,9665 ,9668 ,487 15,290 15,290 8,487 TPC) 0 5 34 -1,448 4 ,746 6,518 8,000 18,349 CFATONPO) -30,000 0 -18,576 801 -5,170 -2,172 2,042 7,118 15,524 9,777 27,524 12,000 27,524 3 4 500 5 Totals 4,127 Table 12.2: Cash flows of computer security project (Project B) Depreciation End of Year Revenue Expanse Flow Flow Cash Flow Before Loan Cash Flow Cash Flow After Loan Interest Amount Taxable Income Taxes Paid Cash Flow After Total Cash Flow Net Profits Total Net Profits Taxes Loan Rate Amount Taxes Profits (t) 0 R/t) 0 30,000 30,000 30,000 30,000 30,000 30,000 180,000 E( D C FBT(0) 50,000 50,000 12,000 18,000 12,000 18,000 12,000 18,000 12,000 18,000 12,000 18,000 12,000 18,000 122,000 58,000 LCF) 25,000 -7,887 -7,887 -7,887 -7,887 0 0 -6,547 CFAL(C) -25,000 10,113 10,113 10,113 10,113 18,000 18,000 51,453 LI(C) 0 2,500 1,961 1.369 717 DR(t) 0 20.00 32.00 19.20 11.52 11.52 5.76 100.00 D(E) 0 10,000 16,000 9,600 5,760 5,760 2,880 50,000 TI(C) 0 5,500 39 7,031 11,523 12,240 15,120 51,453 TP(t) 0 2,200 15 2,812 4,609 4,896 6,048 20,581 CFAT(6) ECFATO -25,000 -25,000 7 ,913 -17,087 10,098 -6,989 7.301 312 5,504 5,816 13,104 1 8,920 11,952 30,872 30,872 NPC) 0 3,300 23 4,219 6 ,914 7,344 9,072 30,872 BO(C) 0 3,300 3,323 7,542 14,456 21,800 30,872 Cumulative Discounted Discounted Net Cash Net CFAT Profits Flow Profits Flows-AT ZCFAT(t) ENP(t). 0 -25,000 -25,000 2 ,870 6 ,881 -18,1192 ,870 18 7,635 -10,484 2.887 2,774 4.800 -5,683 5,661 3,953 3,147 -2,536 3,651 6,515 3,979 13,265 3,922 5,167 9,146 17,187 17,187 9,146 9,614 12.2. PAYBACK PERIOD Totals 6,547 Table 12.5: Project A discounted profits cash flows calculations data for determining present worth and ROI Year Net Profits NP Discounted Net Profits (MARR=15%) Cumulative Discounted Net Profits Depreciation of Investment Book Value (end-of-year) of Investment Average Mid- Year Book Value of Investment During the Year** 50,000 50.000 801 697 697 16,665 33,335 41,667.5 -2,172 -1,643 -946 22,225 11,110 22,222.5 7,118 4,680 3,734 7,405 3,705 7,407.5 4 9,777 5,590 9,324 3,705 0 1,852.5 5 12.000 5,966 15,290 0 0 Totals 27,524 15,290 50,000 98,150 123,150 Include initial investment (50,000) which is used to calculate end-of-year book values ** Mid-Year Book Value = (Previous year book Value + Current year book Value)/2 and Initial Book Value
Step by Step Solution
There are 3 Steps involved in it

Get step-by-step solutions from verified subject matter experts