

Question: solve question 1 a,b,c there is no more information this is a full question Question: 01 8.1 A factory has 10 departments, all of which
solve question 1 a,b,c 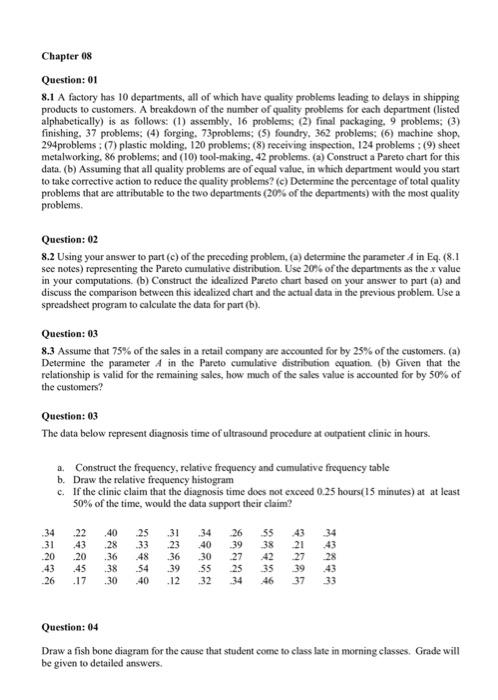
there is no more information this is a full question 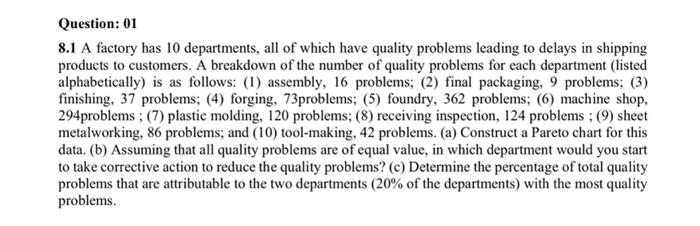
Question: 01 8.1 A factory has 10 departments, all of which have quality problems leading to delays in shipping products to customers. A breakdown of the number of quality problems for each department (listed alphabetically) is as follows: (1) assembly, 16 problems; (2) final packaging, 9 problems; (3) finishing, 37 problems; (4) forging. 73problems; (5) foundry, 362 problems; (6) machine shop. 294 problems ; (7) plastic molding, 120 problems; (8) receiving inspection, 124 problems ; (9) sheet metalworking. 86 problems; and (10) tool-making, 42 problems. (a) Construct a Pareto chart for this data. (b) Assuming that all quality problems are of equal value, in which department would you start to take corrective action to reduce the quality problems? (c) Determine the percentage of total quality problems that are attributable to the two departments (20\% of the departments) with the most quality problems. Question: 02 8.2 Using your answer to part (c) of the preceding problem, (a) determine the parameter A in Eq. (8.1 see notes) representing the Pareto cumulative distribution. Use 20% of the departments as the x value in your computations. (b) Construct the idealized Pareto chart based on your answer to part (a) and discuss the comparison between this idealized chart and the actual data in the previous problem. Use a spreadsheet program to calculate the data for part (b). Question: 03 8.3 Assume that 75% of the sales in a retail company are accounted for by 25% of the customers. (a) Determine the parameter A in the Pareto cumulative distribution equation. (b) Given that the relationship is valid for the remaining sales, how much of the sales value is accounted for by 50% of the customers? Question: 03 The data below represent diagnosis time of ultrasound procedure at outpatient clinic in hours. a. Construct the frequency, relative frequency and cumulative frequency table b. Draw the relative frequency histogram c. If the clinic claim that the diagnosis time does not exceed 0.25 hours( 15 minutes) at at least 50% of the time, would the data support their claim? Question: 04 Draw a fish bone diagram for the eause that student come to class late in morning classes. Grade will be given to detailed answers. Question: 01 8.1 A factory has 10 departments, all of which have quality problems leading to delays in shipping products to customers. A breakdown of the number of quality problems for each department (listed alphabetically) is as follows: (1) assembly, 16 problems; (2) final packaging, 9 problems; (3) finishing, 37 problems; (4) forging, 73problems; (5) foundry, 362 problems; (6) machine shop, 294 problems ; (7) plastic molding, 120 problems; (8) receiving inspection, 124 problems ; (9) sheet metalworking, 86 problems; and (10) tool-making, 42 problems. (a) Construct a Pareto chart for this data. (b) Assuming that all quality problems are of equal value, in which department would you start to take corrective action to reduce the quality problems? (c) Determine the percentage of total quality problems that are attributable to the two departments ( 20% of the departments) with the most quality problems
Step by Step Solution
There are 3 Steps involved in it
1 Expert Approved Answer
Step: 1 Unlock

Question Has Been Solved by an Expert!
Get step-by-step solutions from verified subject matter experts
Step: 2 Unlock
Step: 3 Unlock