

Question: Solve Question # 2: b. Explain the methods used for the presentation of data. c. interpret mean, median and mode for the given data below
Solve
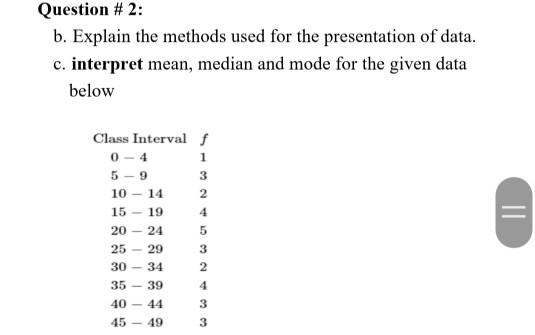
Question # 2: b. Explain the methods used for the presentation of data. c. interpret mean, median and mode for the given data below II Class Interval f 0 - 4 1 5 - 9 3 10-14 2 15 - 19 4 20-24 5 25 - 29 3 30-34 2 35 - 39 4 40 - 44 3 45 - 49 3
Step by Step Solution
There are 3 Steps involved in it
1 Expert Approved Answer
Step: 1 Unlock

Question Has Been Solved by an Expert!
Get step-by-step solutions from verified subject matter experts
Step: 2 Unlock
Step: 3 Unlock