

Question: Solve question 4b) 4) Data tabulated below shows 2-dimensional data for 3 different categories of objects: class 01, 02, and 03. a) Plot a scatterplot
 Solve question 4b)
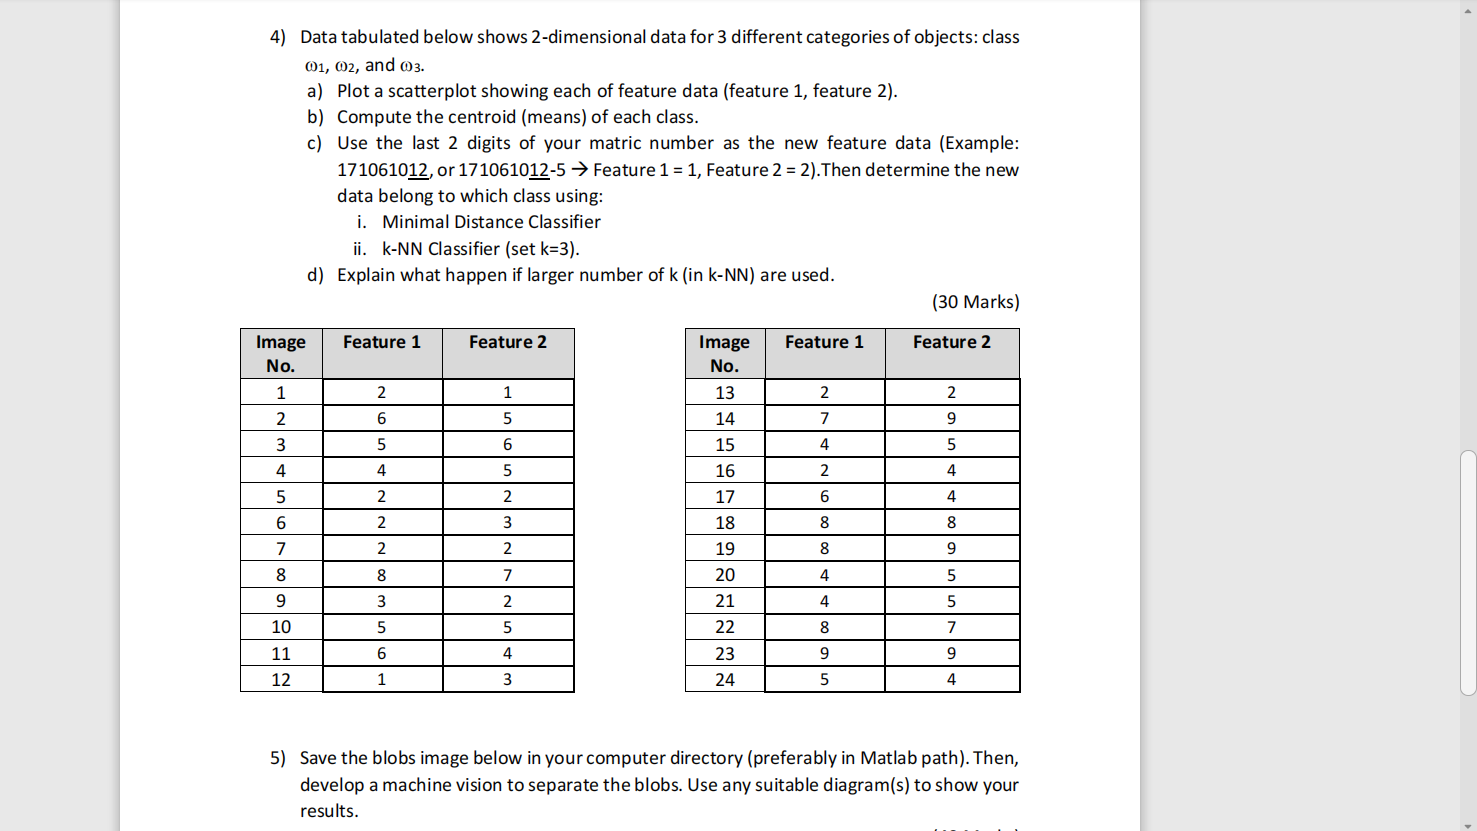
4) Data tabulated below shows 2-dimensional data for 3 different categories of objects: class 01, 02, and 03. a) Plot a scatterplot showing each of feature data (feature 1, feature 2). b) Compute the centroid (means) of each class. c) Use the last 2 digits of your matric number as the new feature data (Example: 171061012, or 171061012-5 Feature 1 = 1, Feature 2 = 2). Then determine the new data belong to which class using: i. Minimal Distance Classifier ii. K-NN Classifier (set k=3). d) Explain what happen if larger number of k (in k-NN) are used. (30 Marks) Feature 1 Feature 2 Feature 1 Feature 2 Image No. 1 2 3 2 1 2 2 6 5 7 9 5 6 4 5 4 5 2 4 Image No. 13 14 15 16 17 18 19 20 21 22 2 2 6 4 5 6 7 4 2 3 8 8 2 2 8 9 8 8 7 4 5 3 2 4 5 9 10 5 5 8 7 6 4 9 9 11 12 23 24 1 3 5 4 5) Save the blobs image below in your computer directory (preferably in Matlab path). Then, develop a machine vision to separate the blobs. Use any suitable diagram(s) to show your results
Step by Step Solution
There are 3 Steps involved in it

Get step-by-step solutions from verified subject matter experts