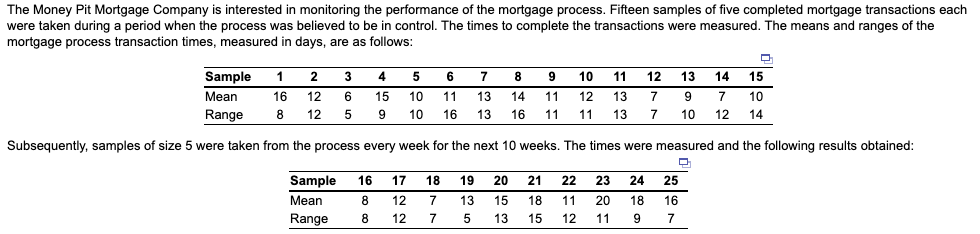
Question: Solve: R chart & X chart, plots, control The Money Pit Mortgage Company is interested in monitoring the performance of the mortgage process. Fifteen samples

Solve: R chart & X chart, plots, control TheSolve: R chart & X chart, plots, control

The Money Pit Mortgage Company is interested in monitoring the performance of the mortgage process. Fifteen samples of five completed mortgage transactions each were taken during a period when the process was believed to be in control. The times to complete the transactions were measured. The means and ranges of the mortgage process transaction times, measured in days, are as follows: Sample 1 2 Mean Range 16 12 8 12 3 6 5 Sample Mean Range 4 15 9 9 5 6 7 8 10 11 13 14 11 10 16 13 16 11 Subsequently, samples of size 5 were taken from the process every week for the next 10 weeks. The times were measured and the following results obtained: Q 16 17 18 8 12 7 8 12 7 19 20 13 5 Q 11 12 13 14 15 9 7 10 10 12 14 10 12 13 7 11 13 7 15 18 13 15 21 22 23 24 25 11 20 18 16 12 11 9 7

Step by Step Solution

There are 3 Steps involved in it

1 Expert Approved Answer
Step: 1 Unlock blur-text-image
Question Has Been Solved by an Expert!

Get step-by-step solutions from verified subject matter experts

Step: 2 Unlock
Step: 3 Unlock

Students Have Also Explored These Related General Management Questions!