Question: Solve the Case study: Financial Statements for Walmart Stores Inc. and Macy's Inc. ( Calculation steps are required.) see attached Tabe 11:07 Supply Chain Management
Solve the Case study: Financial Statements for Walmart Stores Inc. and Macy's Inc. ( Calculation steps are required.)
see attached Tabe
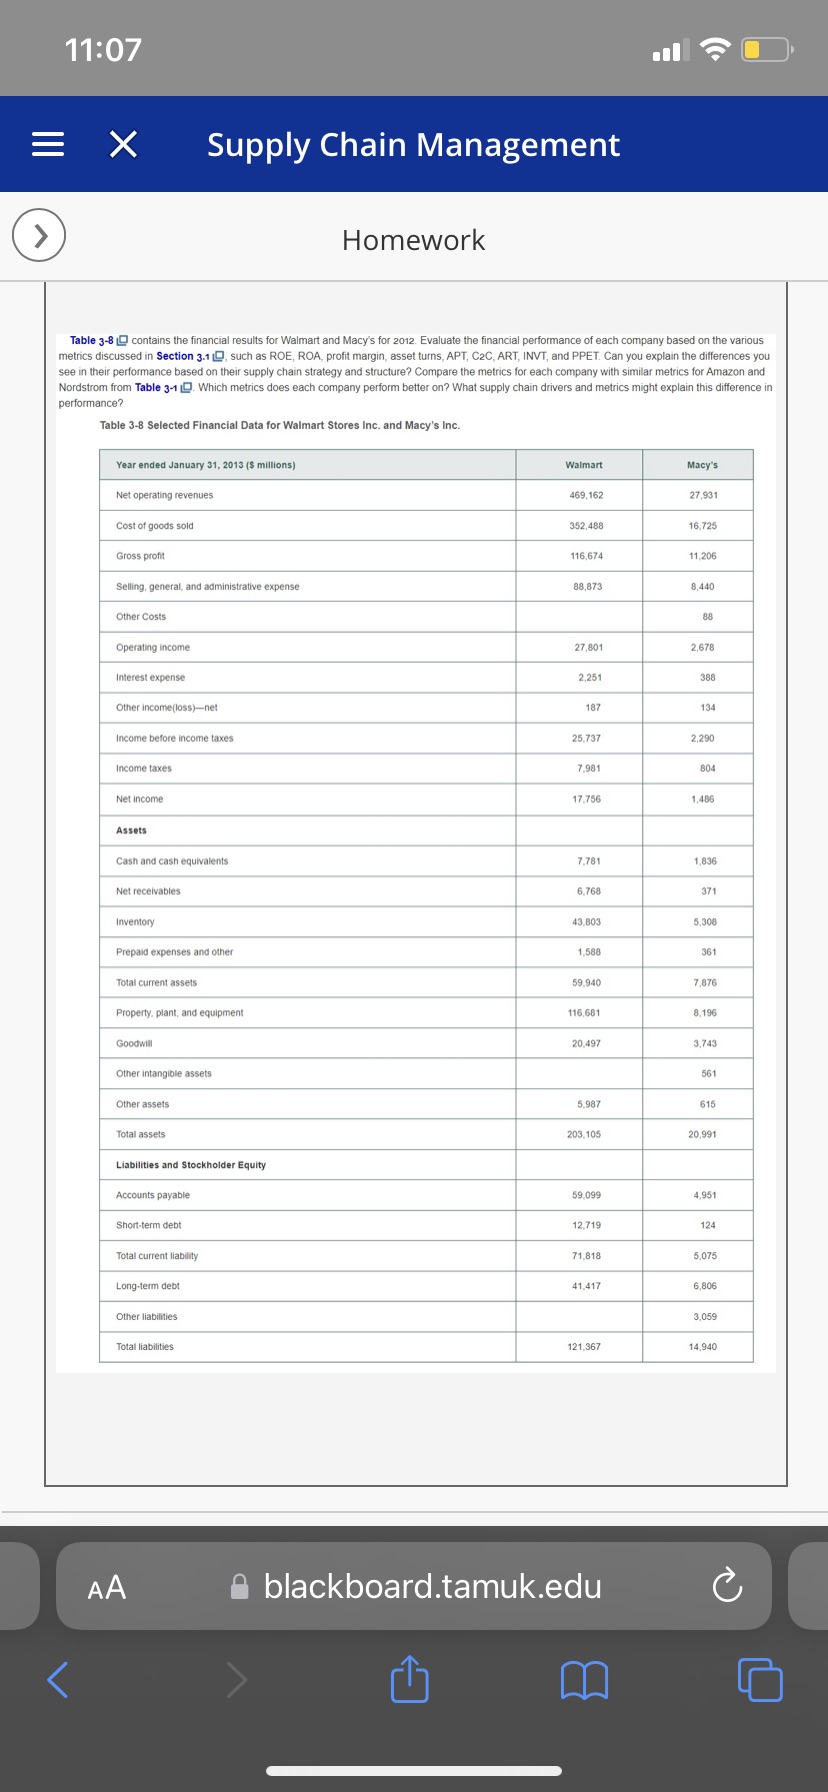
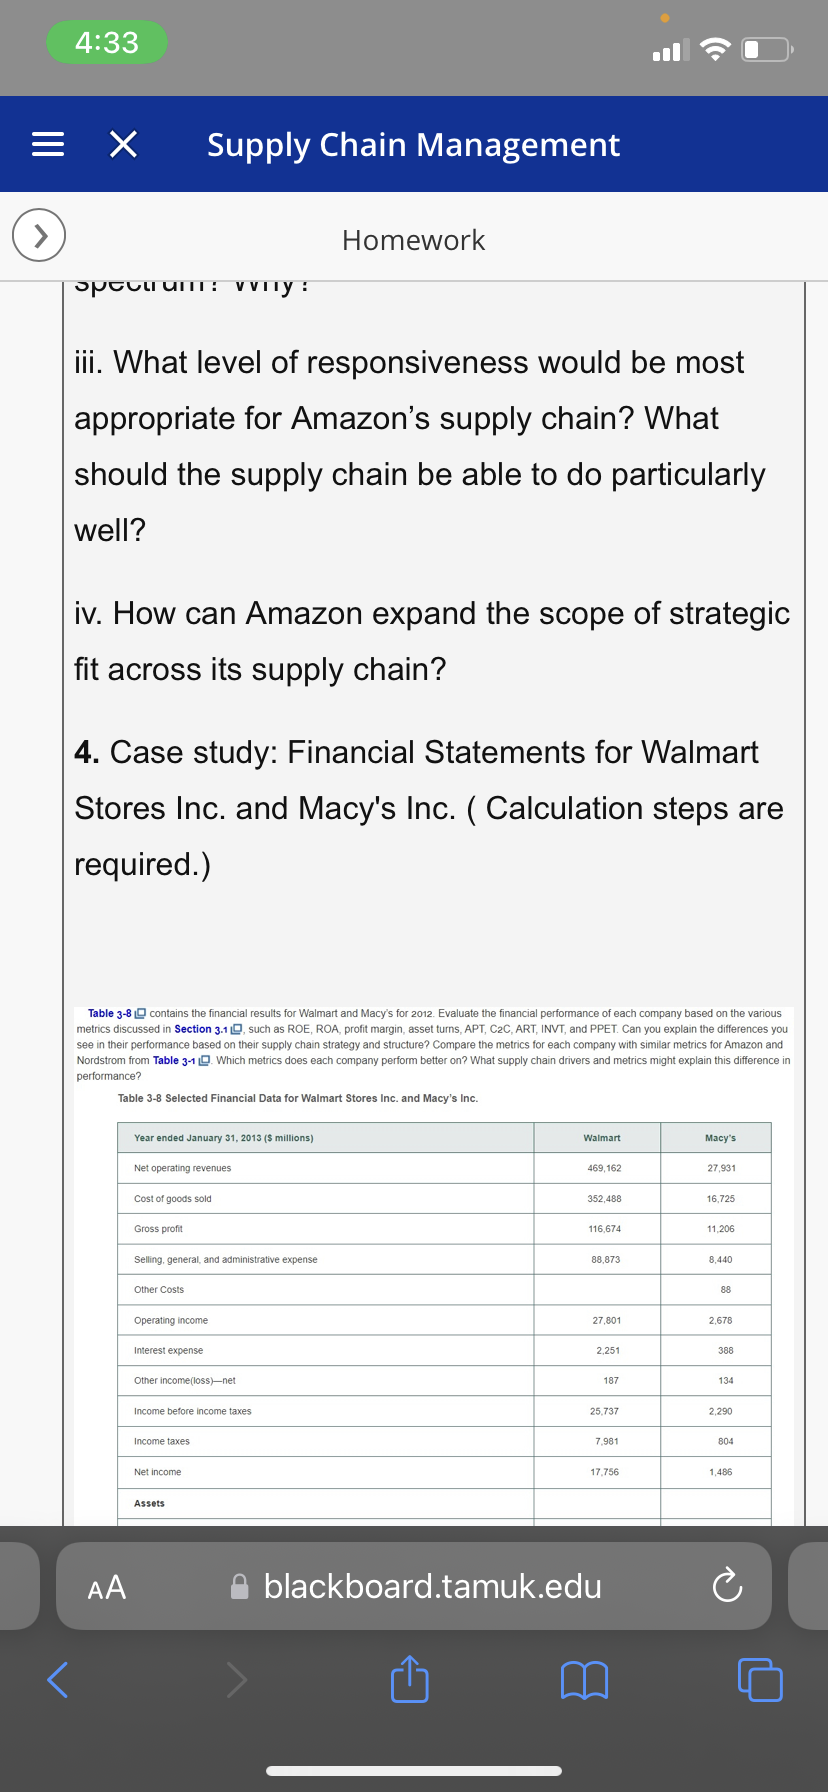
11:07 Supply Chain Management > Homework Table 3-8 0 contains the financial results for Walmart and Macy's for 2012. Evaluate the financial performance of each company based on the various metrics discussed in Section 3.1 0, such as ROE, ROA, profit margin, asset turns, APT, C2C, ART, INVT, and PPET. Can you explain the differences you see in their performance based on their supply chain strategy and structure? Compare the metrics for each company with similar metrics for Amazon and Nordstrom from Table 3-1 Q. Which metrics does each company perform better on? What supply chain drivers and metrics might explain this difference in performance? Table 3-8 Selected Financial Data for Walmart Stores Inc. and Macy's Inc. Year ended January 31, 2013 ($ millions) Walmart Macy's Net operating revenues 469,162 27,931 Cost of goods sold 352,488 16,725 Gross profit 116.674 11,206 Selling, general, and administrative expense 88,873 8.440 Other Costs 88 Operating income 27,801 2,678 Interest expense 2.251 388 Other income(loss)-net 187 134 Income before income taxes 25.737 2.290 Income taxes 7.981 804 Net income 17.756 1,486 Assets Cash and cash equivalents 7.781 1,836 Net receivables 6.768 371 Inventory 43.803 5.308 Prepaid expenses and other 1.588 361 Total current assets 59,940 7.876 Property, plant, and equipment 116,681 8,196 Goodwill 20.497 3,743 Other intangible assets 561 Other assets 5.987 615 Total assets 203,105 20,991 Liabilities and Stockholder Equity Accounts payable 59.099 4,951 Short-term debt 12,719 124 Total current liability 71,818 5.075 Long-term debt 41,417 6,806 Other liabilities 3,059 Total liabilities 121,367 14,940 AA blackboard.tamuk.edu C11:07 Supply Chain Management > Homework Table 3-8 0 contains the financial results for Walmart and Macy's for 2012. Evaluate the financial performance of each company based on the various metrics discussed in Section 3.1 0, such as ROE, ROA, profit margin, asset turns, APT, C2C, ART, INVT, and PPET. Can you explain the differences you see in their performance based on their supply chain strategy and structure? Compare the metrics for each company with similar metrics for Amazon and Nordstrom from Table 3-1 Q. Which metrics does each company perform better on? What supply chain drivers and metrics might explain this difference in performance? Table 3-8 Selected Financial Data for Walmart Stores Inc. and Macy's Inc. Year ended January 31, 2013 ($ millions) Walmart Macy's Net operating revenues 469,162 27,931 Cost of goods sold 352,488 16,725 Gross profit 116.674 11,206 Selling, general, and administrative expense 88,873 8.440 Other Costs 88 Operating income 27,801 2,678 Interest expense 2.251 388 Other income(loss)-net 187 134 Income before income taxes 25.737 2.290 Income taxes 7.981 804 Net income 17.756 1,486 Assets Cash and cash equivalents 7.781 1,836 Net receivables 6.768 371 Inventory 43.803 5.308 Prepaid expenses and other 1.588 361 Total current assets 59,940 7.876 Property, plant, and equipment 116,681 8,196 Goodwill 20.497 3,743 Other intangible assets 561 Other assets 5.987 615 Total assets 203,105 20,991 Liabilities and Stockholder Equity Accounts payable 59.099 4,951 Short-term debt 12,719 124 Total current liability 71,818 5.075 Long-term debt 41,417 6,806 Other liabilities 3,059 Total liabilities 121,367 14,940 AA blackboard.tamuk.edu C4:33 = X Supply Chain Management Homework Opcolumn: vvny : iii. What level of responsiveness would be most appropriate for Amazon's supply chain? What should the supply chain be able to do particularly well? iv. How can Amazon expand the scope of strategic fit across its supply chain? 4. Case study: Financial Statements for Walmart Stores Inc. and Macy's Inc. ( Calculation steps are required.) Table 3-8 0 contains the financial results for Walmart and Macy's for 2012. Evaluate the financial performance of each company based on the various metrics discussed in Section 3.1 ID, such as ROE, ROA, profit margin, asset turns, APT, C2C, ART, INVT, and PPET. Can you explain the differences you see in their performance based on their supply chain strategy and structure? Compare the metrics for each company with similar metrics for Amazon and Nordstrom from Table 3-1 D. Which metrics does each company perform better on? What supply chain drivers and metrics might explain this difference in performance? Table 3-8 Selected Financial Data for Walmart Stores Inc. and Macy's Inc. Year ended January 31, 2013 ($ millions) Walmart Macy's Net operating revenues 469,162 27,931 Cost of goods sold 352,488 16,725 Gross profit 116,674 11,206 Selling, general, and administrative expense 88,873 8,440 Other Costs 8:8 Operating income 27,801 2.678 Interest expense 2.251 388 Other income(loss)-net 187 134 Income before income taxes 25.737 2,290 Income taxes 7,981 804 Net income 17.756 1,486 Assets AA blackboard.tamuk.edu