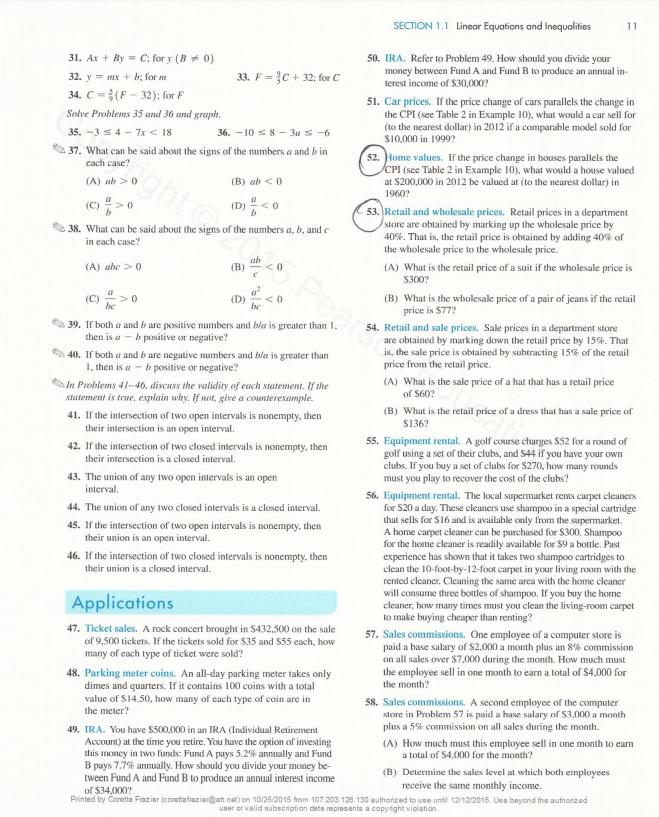
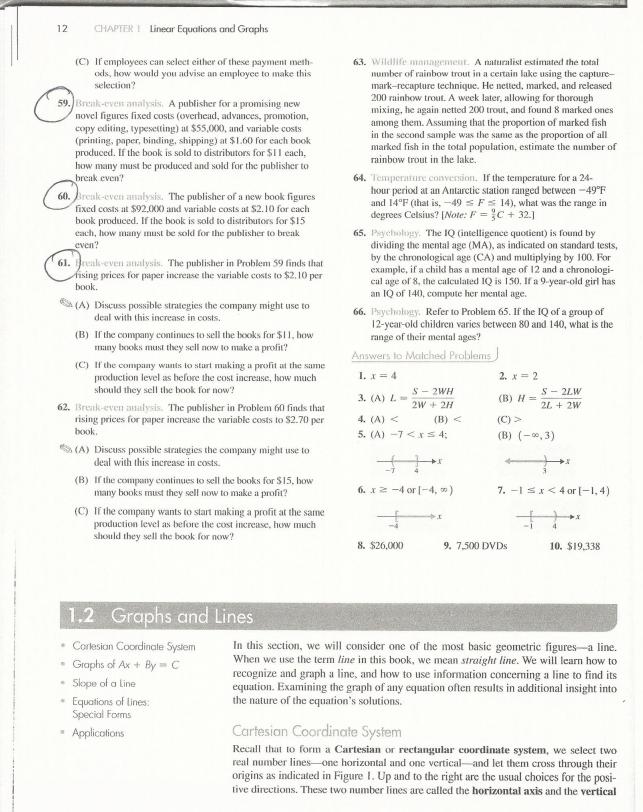
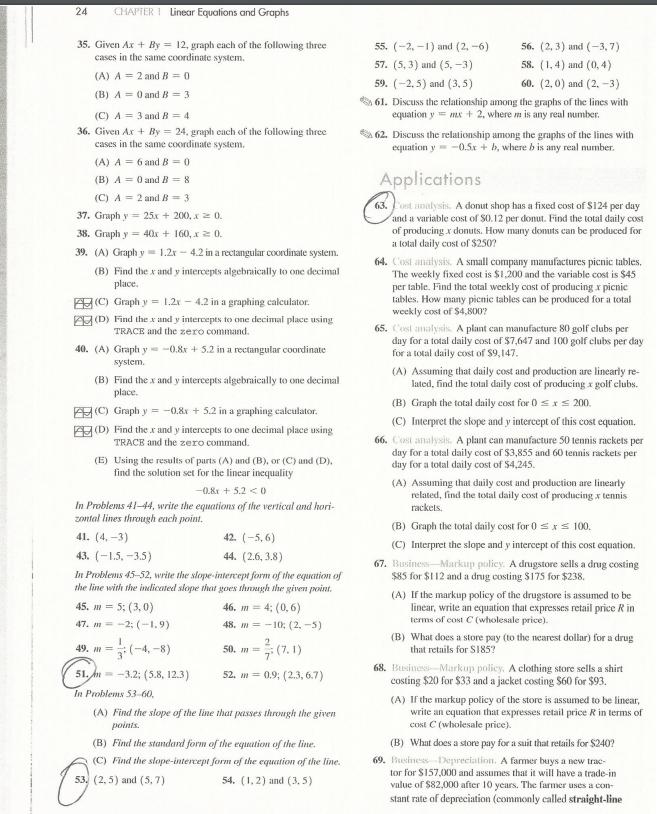
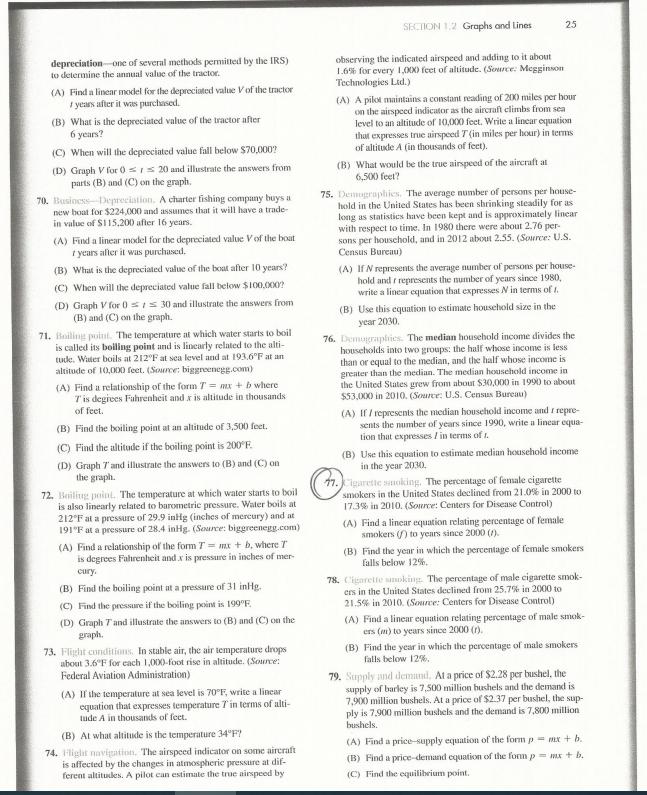
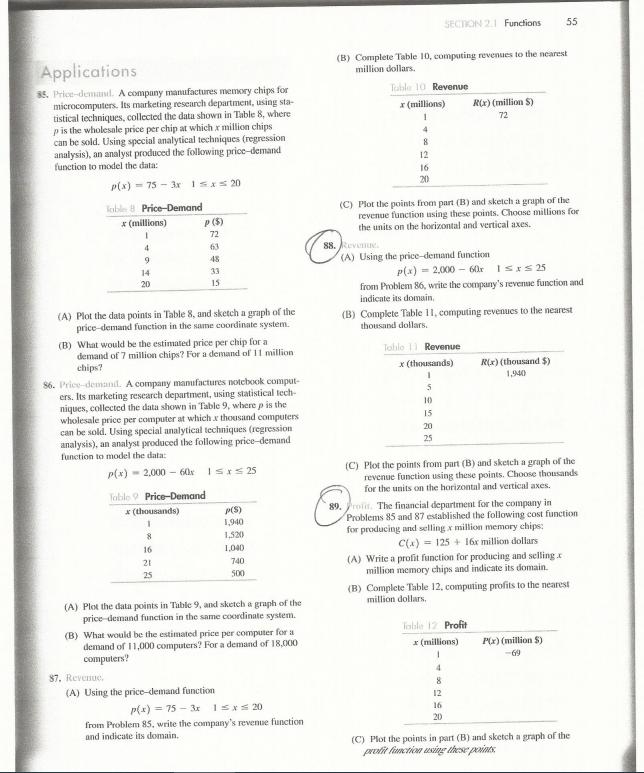
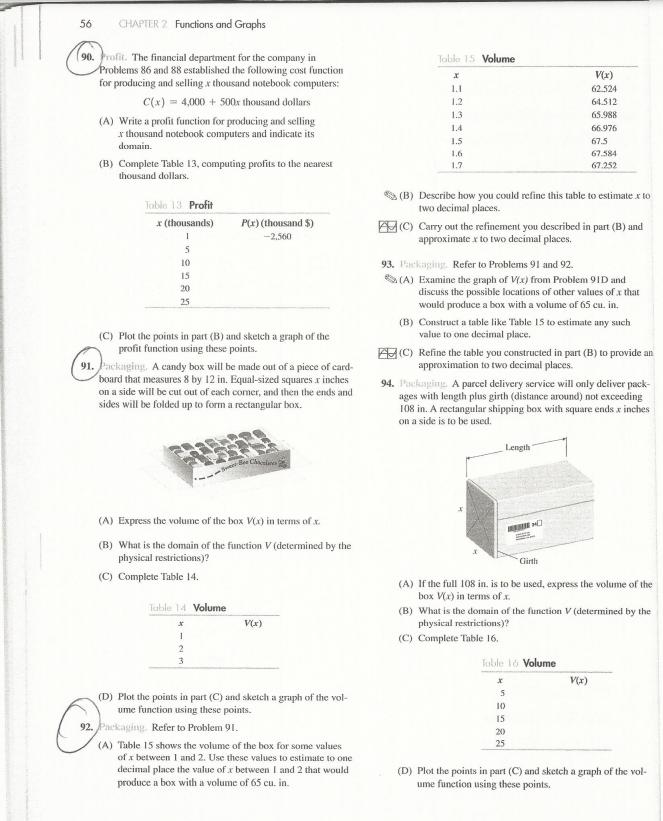
solve the circled questions 31. Ax+By C; for y (B 0) 32. y=mx+b; for m 34. C (F-32); for F
No answer yet for this question.
Ask a Tutor
Question:
solve the circled questions
Transcribed Image Text:
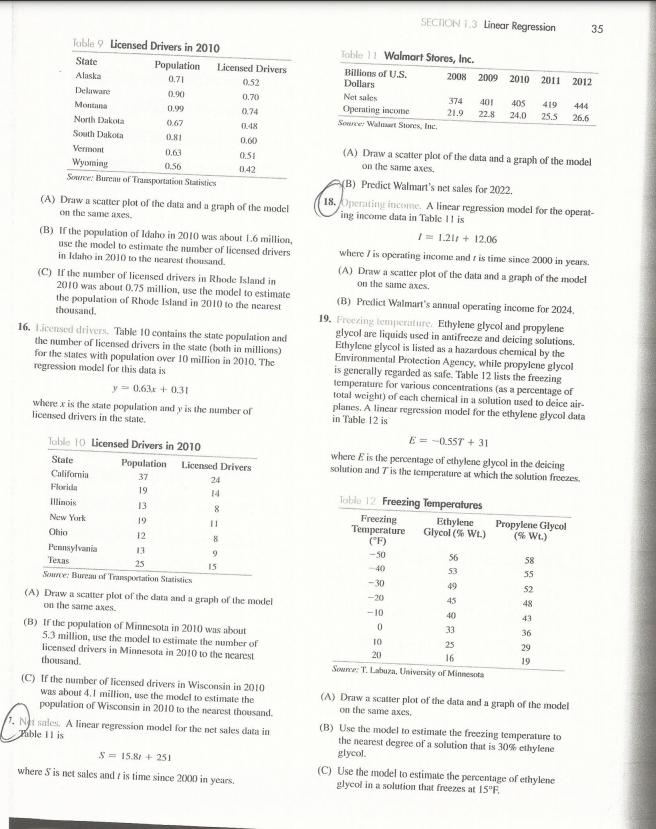
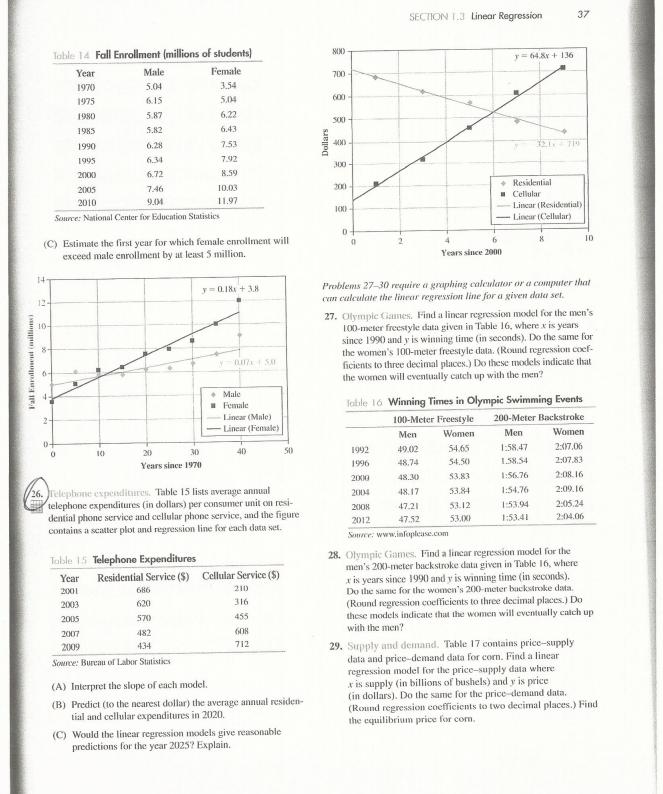
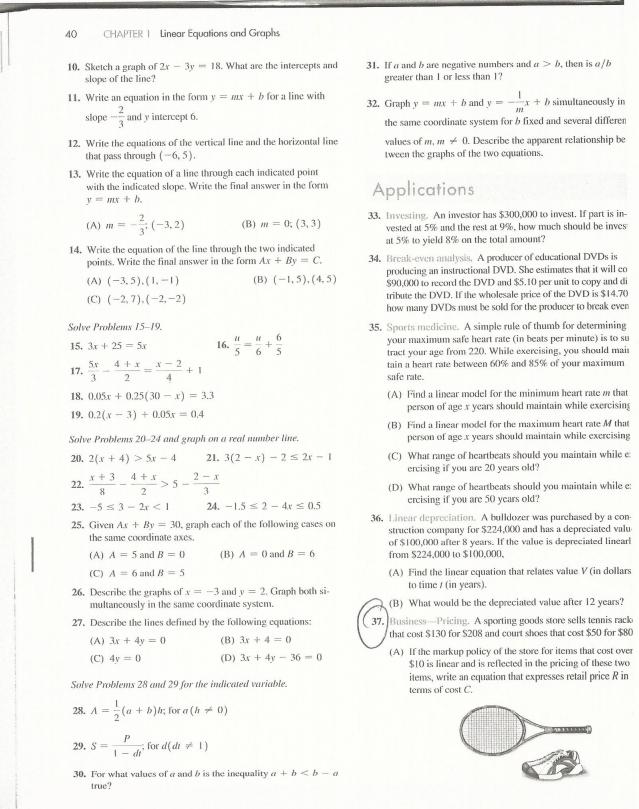
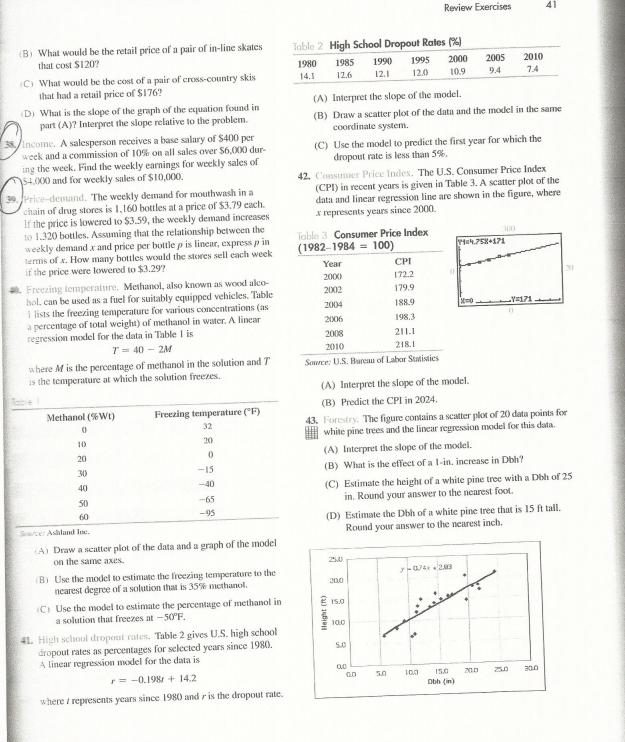
31. Ax+By C; for y (B 0) 32. y=mx+b; for m 34. C (F-32); for F Solve Problems 35 and 36 and graph. 35.-34-7x < 18 36.-1083μ-6 37. What can be said about the signs of the numbers a and b in each case? (A) ab > 0 ght 38. What can be said about the signs of the numbers a, b, and c in each case? (A) abc > 0) (C) 20 33. FC + 32; for C >0 (B) ab < 0 (B) (D) ab <0 <0 be be 39. If both a and bare positive numbers and bla is greater than 1. then is a - b positive or negative? 40. If both a and bare negative numbers and bla is greater than 1, then is a - b positive or negative? In Problems 41-46, discuss the validity of each statement. If the statement is true, explain why. If not, give a counterexample. 41. If the intersection of two open intervals is nonempty, then their intersection is an open interval. 42. If the intersection of two closed intervals is nonempty, then their intersection is a closed interval. 43. The union of any two open intervals is an open interval. 44. The union of any two closed intervals is a closed interval. 45. If the intersection of two open intervals is nonempty, then their union is an open interval. 46. If the intersection of two closed intervals is nonempty, then their union is a closed interval. Applications 47. Ticket sales. A rock concert brought in $432,500 on the sale of 9,500 tickets. If the tickets sold for $35 and $55 each, how many of each type of ticket were sold? 48. Parking meter coins. An all-day parking meter takes only dimes and quarters. If it contains 100 coins with a total value of $14.50, how many of each type of coin are in the meter? SECTION 1.1 Linear Equations and Inequalities 11 50. IRA. Refer to Problem 49. How should you divide your money between Fund A and Fund B to produce an annual in- terest income of $30,000? 51. Car prices. If the price change of cars parallels the change in the CPI (see Table 2 in Example 10), what would a car sell for (to the nearest dollar) in 2012 if a comparable model sold for $10,000 in 1999? 52. Home values. If the price change in houses parallels the CPI (see Table 2 in Example 10), what would a house valued at $200,000 in 2012 be valued at (to the nearest dollar) in 1960? 53. Retail and wholesale prices. Retail prices in a department store are obtained by marking up the wholesale price by 40%. That is, the retail price is obtained by adding 40% of the wholesale price to the wholesale price. (A) What is the retail price of a suit if the wholesale price is $300? (B) What is the wholesale price of a pair of jeans if the retail price is $77? 54. Retail and sale prices. Sale prices in a department store are obtained by marking down the retail price by 15%. That is, the sale price is obtained by subtracting 15% of the retail price from the retail price. (A) What is the sale price of a hat that has a retail price of $60? (B) What is the retail price of a dress that has a sale price of $136? 55. Equipment rental. A golf course charges $52 for a round of golf using a set of their clubs, and S44 if you have your own clubs. If you buy a set of clubs for $270, how many rounds must you play to recover the cost of the clubs? 56. Equipment rental. The local supermarket rents carpet cleaners for $20 a day. These cleaners use shampoo in a special cartridge that sells for $16 and is available only from the supermarket. A home carpet cleaner can be purchased for $300. Shampoo for the home cleaner is readily available for $9 a bottle. Past experience has shown that it takes two shampoo cartridges to clean the 10-foot-by-12-foot carpet in your living room with the rented cleaner. Cleaning the same area with the home cleaner will consume three bottles of shampoo. If you buy the home cleaner, how many times must you clean the living-room carpet to make buying cheaper than renting? 57. Sales commissions. One employee of a computer store is paid a base salary of $2.000 a month plus an 8% commission on all sales over $7,000 during the month. How much must the employee sell in one month to earn a total of $4,000 for the month? 58. Sales commissions. A second employee of the computer store in Problem 57 is paid a base salary of $3,000 a month plus a 5% commission on all sales during the month. 49. IRA. You have $500,000 in an IRA (Individual Retirement Account) at the time you retire. You have the option of investing this money in two funds: Fund A pays 5.2% annually and Fund B pays 7.7% annually. How should you divide your money be- tween Fund A and Fund B to produce an annual interest income of $34,000? Printed by Coretta Frazier (coratafiazion@att.nation 10/25/2015 from 107,203 129 130 authorized to use until 12/12/2015. Use beyond the authorized user or valid subscription date represents a copyright violation (A) How much must this employee sell in one month to earn a total of $4,000 for the month? (B) Determine the sales level at which both employees receive the same monthly income. 12 CHAPTER Linear Equations and Graphs 59. Break-even analysis. A publisher for a promising new novel figures fixed costs (overhead, advances, promotion, copy editing, typesetting) at $55,000, and variable costs (printing, paper, binding, shipping) at $1.60 for each book produced. If the book is sold to distributors for $11 each, how many must be produced and sold for the publisher to break even? (C) If employees can select either of these payment meth- ods, how would you advise an employce to make this selection? 60. Break-even analysis. The publisher of a new book figures fixed costs at $92,000 and variable costs at $2.10 for each book produced. If the book is sold to distributors for $15 each, how many must be sold for the publisher to break even? 61. Break-even analysis. The publisher in Problem 59 finds that fising prices for paper increase the variable costs to $2.10 per book. . . (A) Discuss possible strategies the company might use to deal with this increase in costs. (B) If the company continues to sell the books for $11, how many books must they sell now to make a profit? 62. Break-even analysis. The publisher in Problem 60 finds that rising prices for paper increase the variable costs to $2.70 per book. (C) If the company wants to start making a profit at the same production level as before the cost increase, how much should they sell the book for now? (A) Discuss possible strategies the company might use to deal with this increase in costs. (B) If the company continues to sell the books for $15, how many books must they sell now to make a profit? (C) If the company wants to start making a profit at the same production level as before the cost increase, how much should they sell the book for now? 1.2 Graphs and Lines Corlesian Coordinate System Graphs of Ax+ By C . Slope of a Line Equations of lines: Special Forms Applications 63. Wildlife management. A naturalist estimated the total number of rainbow trout in a certain lake using the capture- mark-recapture technique. He netted, marked, and released 200 rainbow trout. A week later, allowing for thorough mixing, he again netted 200 trout, and found 8 marked ones among them. Assuming that the proportion of marked fish in the second sample was the same as the proportion of all marked fish in the total population, estimate the number of rainbow trout in the lake. 64. Temperature conversion. If the temperature for a 24- hour period at an Antarctic station ranged between -49°F and 14°F (that is, -49 s F 14), what was the range in degrees Celsius? [Note: F=C+32] 65. Psychology. The IQ (intelligence quotient) is found by dividing the mental age (MA), as indicated on standard tests, by the chronological age (CA) and multiplying by 100. For example, if a child has a mental age of 12 and a chronologi- cal age of 8, the calculated IQ is 150. If a 9-year-old girl has an IQ of 140, compute her mental age. 66. Psychology. Refer to Problem 65. If the IQ of a group of 12-year-old children varies between 80 and 140, what is the range of their mental ages? Answers to Matched Problems I. x = 4 S-2WH 2W + 2H 3. (A) L 4. (A) < 5. (A) -7 < x≤ 4; 8. $26,000 (B) < 6. x-4 or 1-4,*) 2. x = 2 (B) H= (C) > (B) (-0,3) S2LW 2L+ 2W 7.-1 ≤ x < 4 or [-1,4) 9. 7,500 DVDs 4 10. $19,338 In this section, we will consider one of the most basic geometric figures a line. When we use the term line in this book, we mean straight line. We will learn how to i recognize and graph a line, and how to use information concerning a line to find its equation. Examining the graph of any equation often results in additional insight into the nature of the equation s solutions. Cartesian Coordinate System Recall that to form a Cartesian or rectangular coordinate system, we select two real number lines-one horizontal and one vertical and let them cross through their origins as indicated in Figure 1. Up and to the right are the usual choices for the posi- tive directions. These two number lines are called the horizontal axis and the vertical CHAPTER 1 Linear Equations and Graphs 35. Given Ax+By 12, graph each of the following three cases in the same coordinate system. (A) A = 2 and B = 0 (B) A = 0 and B = 3 24 (C) A = 3 and B = 4 36. Given Ax + By = 24, graph each of the following three cases in the same coordinate system. (A) A = 6 and B=0 (B) A = 0 and B = 8 (C) A = 2 and B3 37. Graph y = 25x + 200, x = 0. 38. Graph y = 40x + 160, x = 0. 39. (A) Graphy 1.2x - 4.2 in a rectangular coordinate system. (B) Find the x and y intercepts algebraically to one decimal place. (C) Graph y = 1.2x - 4.2 in a graphing calculator. (D) Find the x and y intercepts to one decimal place using TRACE and the zero command. 40. (A) Graphy-0.8x + 5.2 in a rectangular coordinate system. (B) Find the x and y intercepts algebraically to one decimal place. (C) Graph y=-0.8x + 5.2 in a graphing calculator. (D) Find the x and y intercepts to one decimal place using TRACE and the zero command. (E) Using the results of parts (A) and (B), or (C) and (D), find the solution set for the linear inequality -0.8x + 5.20 In Problems 41-44, write the equations of the vertical and hori zontal lines through each point. 41. (4.-3) 42. (-5,6) 44. (2.6,3.8) 43. (-1.5.-3.5) In Problems 45-52, write the slope-intercept form of the equation of the line with the indicated slope that goes through the given point. 45. m = 5; (3,0) 47. m-2;(-1.9) 49. m = 51.-3.2; (5.8, 12.3) In Problems 53-60. 46. m = 4; (0,6) 48. m-10; (2,-5) 2 50. m = (7.1) 52. m=0.9; (2.3, 6.7) (A) Find the slope of the line that passes through the given points. (B) Find the standard form of the equation of the line. (C) Find the slope-intercept form of the equation of the line. 53, (2,5) and (5,7) 54. (1,2) and (3.5) 55. (-2,-1) and (2,-6) 57. (5,3) and (5,-3) 56. (2, 3) and (-3,7) 58. (1,4) and (0,4) 59. (-2,5) and (3,5) 60. (2,0) and (2.-3) 61. Discuss the relationship among the graphs of the lines with equation y = mx + 2, where m is any real number. 62. Discuss the relationship among the graphs of the lines with equation y = -0.5x + b, where b is any real number. Applications 63. Cost analysis. A donut shop has a fixed cost of $124 per day and a variable cost of $0.12 per donut. Find the total daily cost of producing x donuts. How many donuts can be produced for a total daily cost of $250? 64. Cost analysis. A small company manufactures picnic tables. The weekly fixed cost is $1,200 and the variable cost is $45 per table. Find the total weekly cost of producing x picnic tables. How many picnic tables can be produced for a total weekly cost of $4,800? 65. Cost analysis. A plant can manufacture 80 golf clubs per day for a total daily cost of $7,647 and 100 golf clubs per day for a total daily cost of $9,147. (A) Assuming that daily cost and production are linearly re- lated, find the total daily cost of producing x golf clubs. (B) Graph the total daily cost for 0 ≤ x ≤ 200. (C) Interpret the slope and y intercept of this cost equation. 66. Cost analysis. A plant can manufacture 50 tennis rackets per day for a total daily cost of $3,855 and 60 tennis rackets per day for a total daily cost of $4,245. (A) Assuming that daily cost and production are linearly related, find the total daily cost of producing tennis rackets. (B) Graph the total daily cost for 0 ≤ x ≤ 100. (C) Interpret the slope and y intercept of this cost equation. 67. Business Markup policy. A drugstore sells a drug costing $85 for $112 and a drug costing $175 for $238. (A) If the markup policy of the drugstore is assumed to be linear, write an equation that expresses retail price R in terms of cost C (wholesale price). (B) What does a store pay (to the nearest dollar) for a drug that retails for $185? 68. Business Markup policy. A clothing store sells a shirt costing $20 for $33 and a jacket costing $60 for $93. (A) If the markup policy of the store is assumed to be linear, write an equation that expresses retail price R in terms of cost C (wholesale price). (B) What does a store pay for a suit that retails for $240? 69. Business Depreciation. A farmer buys a new trac- tor for $157,000 and assumes that it will have a trade-in value of $82,000 after 10 years. The farmer uses a con- stant rate of depreciation (commonly called straight-line depreciation one of several methods permitted by the IRS) to determine the annual value of the tractor. (A) Find a linear model for the depreciated value V of the tractor 1 years after it was purchased. (B) What is the depreciated value of the tractor after 6 years? (C) When will the depreciated value fall below $70,000? (D) Graph V for 0=20 and illustrate the answers from parts (B) and (C) on the graph, 70. Business-Depreciation. A charter fishing company buys a new boat for $224,000 and assumes that it will have a trade- in value of $115,200 after 16 years. (A) Find a linear model for the depreciated value V of the boat 1 years after it was purchased. (B) What is the depreciated value of the boat after 10 years? (C) When will the depreciated value fall below $100,000 (D) Graph V for 01 30 and illustrate the answers from (B) and (C) on the graph. 71. Boiling point. The temperature at which water starts to boil is called its boiling point and is lincarly related to the alti- tude. Water boils at 212°F at sea level and at 193.6°F at an altitude of 10,000 feet. (Source: biggreenegg.com) (A) Find a relationship of the form 7= mx + b where T is degives Fahrenheit and x is altitude in thousands of feet. (B) Find the boiling point at an altitude of 3,500 feet. (C) Find the altitude if the boiling point is 200°F. (D) Graph 7 and illustrate the answers to (B) and (C) on the graph. 72. Boiling point. The temperature at which water starts to boil is also linearly related to barometric pressure. Water boils at 212°F at a pressure of 29.9 inHg (inches of mercury) and at 191°F at a pressure of 28.4 inHg. (Source: biggreenegg.com) (A) Find a relationship of the form T=mx+b, where T is degrees Fahrenheit and x is pressure in inches of mer- cury. (B) Find the boiling point at a pressure of 31 inHg. (C) Find the pressure if the boiling point is 199°F. (D) Graph 7 and illustrate the answers to (B) and (C) on the graph. 73. Flight conditions. In stable air, the air temperature drops about 3.6°F for each 1,000-foot rise in altitude. (Source: Federal Aviation Administration) (A) If the temperature at sea level is 70°F, write a linear equation that expresses temperature 7 in terms of alti- tude A in thousands of feet. (B) At what altitude is the temperature 34°F? 74. Higit navigation. The airspeed indicator on some aircraft is affected by the changes in atmospheric pressure at dif- ferent altitudes. A pilot can estimate the true airspeed by SECTION 1.2 Graphs and Lines observing the indicated airspeed and adding to it about 1.6% for every 1,000 feet of altitude. (Source: Megginson Technologies Ltd.) 25 (A) A pilot maintains a constant reading of 200 miles per hour on the airspeed indicator as the aircraft climbs from sea level to an altitude of 10,000 feet. Write a linear equation that expresses true airspeed 7 (in miles per hour) in terms of altitude A (in thousands of feet), (B) What would be the true airspeed of the aircraft at 6,500 feet? 75. Demographics. The average number of persons per house- hold in the United States has been shrinking steadily for as long as statistics have been kept and is approximately linear with respect to time. In 1980 there were about 2.76 per- sons per household, and in 2012 about 2.55. (Source: U.S. Census Bureau) (A) If N represents the average number of persons per house- hold and r represents the number of years since 1980, write a linear equation that expresses N in terms of 1. (B) Use this equation to estimate household size in the year 2030, 76. Demographics. The median household income divides the households into two groups: the half whose income is less than or equal to the median, and the half whose income is greater than the median. The median household income in the United States grew from about $30,000 in 1990 to about $53,000 in 2010. (Source: U.S. Census Bureau) (A) If / represents the median household income and repre- sents the number of years since 1990, write a linear equa- tion that expresses / in terms of 1. (B) Use this equation to estimate median household income in the year 2030. 17. Cigarette smoking. The percentage of female cigarette 17.3% in 2010. (Source: Centers for Disease Control) (A) Find a linear equation relating percentage of female smokers () to years since 2000 (1) (B) Find the year in which the percentage of female smokers falls below 12%. 78. Cigarette smoking. The percentage of male cigarette smok- ers in the United States declined from 25.7% in 2000 to 21.5% in 2010. (Source: Centers for Disease Control) (A) Find a linear equation relating percentage of male smok- ers (m) to years since 2000 (r). (B) Find the year in which the percentage of male smokers falls below 12%. 79. Supply and demand. At a price of $2.28 per bushel, the supply of barley is 7,500 million bushels and the demand is 7,900 million bushels. At a price of $2.37 per bushel, the sup- ply is 7,900 million bushels and the demand is 7,800 million bushels. (A) Find a price-supply equation of the form p = mx + b. (B) Find a price-demand equation of the form p = mx + b. (C) Find the equilibrium point. Table 9 Licensed Drivers in 2010 State Alaska Delaware Montana North Dakota South Dakota Vermont Wyoming Source: Bureau of Transportation Statistics Population Licensed Drivers 0.71 0.90 0.99 0.67 0.81 0.63 0.56 (A) Draw a scatter plot of the data and a graph of the model on the same axes. (B) If the population of Idaho in 2010 was about 1.6 million, use the model to estimate the number of licensed drivers in Idaho in 2010 to the nearest thousand. (C) If the number of licensed drivers in Rhode Island in 2010 was about 0.75 million, use the model to estimate the population of Rhode Island in 2010 to the nearest thousand. 16. Licensed drivers. Table 10 contains the state population and the number of licensed drivers in the state (both in millions) for the states with population over 10 million in 2010. The regression model for this data is Toble 10 Licensed Drivers in 2010 State Population California 37 Florida Illinois New York Ohio y = 0.63x + 0.31 where x is the state population and y is the number of licensed drivers in the state. 19 13 19 12 24 14 0.52 0.70 0.74 Licensed Drivers 8 0.48 0.60 0.51 0.42 11 8 9 13 Pennsylvania Texas 25 Source: Bureau of Transportation Statistics (A) Draw a scatter plot of the data and a graph of the model on the same axes. 15 (B) If the population of Minnesota in 2010 was about 5.3 million, use the model to estimate the number of licensed drivers in Minnesota in 2010 to the nearest thousand. $ = 15.8 +251 where S is net sales and ris time since 2000 in years. (C) If the number of licensed drivers in Wisconsin in 2010 was about 4.1 million, use the model to estimate the population of Wisconsin in 2010 to the nearest thousand. 1. Nt sales. A linear regression model for the net sales data in Table 11 is Table 11 Walmart Stores, Inc. Billions of U.S. Dollars SECTION 1.3 Linear Regression Net sales Operating income Source: Walmart Stones, Inc. 2008 2009 2010 374 21.9 -10 0 (A) Draw a scatter plot of the data and a graph of the model on the same axes. 401 405 419 22.8 24.0 (B) Predict Walmart s net sales for 2022. 18. Operating income. A linear regression model for the operat- ing income data in Table 11 is 10 /= 1.21 + 12.06 where / is operating income and r is time since 2000 in years. (A) Draw a scatter plot of the data and a graph of the model on the same axes. (B) Predict Walmart s annual operating income for 2024. 19. Freezing temperature. Ethylene glycol and propylene glycol are liquids used in antifreeze and deicing solutions. Ethylene glycol is listed as a hazardous chemical by the Environmental Protection Agency, while propylene glycol is generally regarded as safe. Table 12 lists the freezing temperature for various concentrations (as a percentage of total weight) of each chemical in a solution used to deice air- planes. A linear regression model for the ethylene glycol data in Table 12 is Table 12 Freezing Temperatures Ethylene Freezing Temperature (°F) Glycol (% Wt.) -50 -40 Fall Enrollosent (millions) 147 12- 10- Table 14 Fall Enrollment (millions of students) Year Female 1970 3.54 1975 5,04 1980 6,22 1985 6.43 7.53 7.92 8.59 (C) Estimate the first year for which female enrollment will exceed male enrollment by at least 5 million. 2- 5.87 5.82 1990 6.28 1995 6.34 2000 6.72 2005 7.46 2010 9.04 Source: National Center for Education Statistics Male 5.04 6.15 0+ 0 10 30 20 Years since 1970 10.03 11.97 686 620 570 482 434 y 0.18 +3.8 2007 2009 Source: Bureau of Labor Statistics DUTT SA Male Female Linear (Male) Linear (Female) 26. Telephone expenditures. Table 15 lists average annual telephone expenditures (in dollars) per consumer unit on resi- dential phone service and cellular phone service, and the figure contains a scatter plot and regression line for each data set. Table 15 Telephone Expenditures Year Residential Service ($) Cellular Service ($) 2001 2003 2005 40 210 316 455 608 712 50 (A) Interpret the slope of each model. (B) Predict (to the nearest dollar) the average annual residen- tial and cellular expenditures in 2020. (C) Would the linear regression models give reasonable predictions for the year 2025? Explain. Dollars 800 700- 600- 500- 400 300- 200- 100 0 0 SECTION 1.3 Linear Regression 6 4 Years since 2000 1992 1996 Men 49.02 48.74 48.30 48.17 47.21 47.52 y 64.8x + 136 2000 2004 2008 2012 Source: www.infoplease.com 37 32.1 - 710 Problems 27-30 require a graphing calculator or a computer that can calculate the linear regression line for a given data set. 53.12 53.00 Residential Cellular Linear (Residential) Linear (Cellular) 8 27. Olympic Games. Find a linear regression model for the men s 100-meter freestyle data given in Table 16, where x is years since 1990 and y is winning time (in seconds). Do the same for the women s 100-meter freestyle data. (Round regression coef- ficients to three decimal places.) Do these models indicate that the women will eventually catch up with the men? Table 16 Winning Times in Olympic Swimming Events 100-Meter Freestyle Women 54.65 54.50 53.83 53.84 10 200-Meter Backstroke Men Women 1:58.47 2:07.06 1.58.54 2:07.83 1:56.76 2:08.16 1:54.76 2:09.16 1:53.94 2:05.24 1:53.41 2:04.06 28. Olympic Games. Find a linear regression model for the men s 200-meter backstroke data given in Table 16, where xis years since 1990 and y is winning time (in seconds). Do the same for the women s 200-meter backstroke data. (Round regression coefficients to three decimal places.) Do these models indicate that the women will eventually catch up with the men? 29. Supply and demand. Table contains price-supply data and price-demand data for corn. Find a linear regression model for the price-supply data where x is supply (in billions of bushels) and y is price (in dollars). Do the same for the price-demand data. (Round regression coefficients to two decimal places.) Find the equilibrium price for com. CHAPTER Linear Equations and Graphs 10. Sketch a graph of 2x-3y 18. What are the intercepts and slope of the line? 40 11. Write an equation in the form y= mx + b for a line with 2 slope and y intercept 6. 12. Write the equations of the vertical line and the horizontal line that pass through (-6,5). 13. Write the equation of a line through each indicated point with the indicated slope. Write the final answer in the form y=mx+b. (A) = (-3.2) (B) m = 0; (3, 3) 14. Write the equation of the line through the two indicated points. Write the final answer in the form Ax+By = C. (A) (-3,5),(1,-1) (B) (-1,5),(4,5) (C) (-2,7).(-2,-2) Solve Problems 15-19. 15. 3x + 255x 17. 2 5r 4+x x-2 3 2 4 22. 18. 0.05x+0.25(30-x) = 3.3 19. 0.2(x-3) +0.05x = 0,4 +1 Solve Problems 20-24 and graph on a real number line. 20. 2(x+4) > Sx-4 x+3 (A) A = 5 and B=0 (C) A 6 and B=5 >5- 29. S= 16. P 1- di 6 21. 3(2-x) - 2 ≤2x-1 2-x 3 23.-53-2x < 1 25. Given Ax + By = 30, graph each of the following cases on the same coordinate axes. (B) A = 0 and B=6 24. -1.52-4x0.5 26. Describe the graphs of x=-3 and y = 2. Graph both si- multaneously in the same coordinate system. 27. Describe the lines defined by the following equations: (A) 3x+4y=01 (B) 3x +4 () (C) 4y = 0 (D) 3x+4y-36-0 Solve Problems 28 and 29 for the indicated variable. 28. A = (a + b)h; for a(h+ 0) for d(dt 1) 30. For what values of a and b is the inequality a + b < b_a true? 31. Ifa and bare negative numbers and a> b, then is a/b greater than I or less than 1? 1 M 32. Graph y mx + b and y= x+b simultaneously in the same coordinate system for b fixed and several differen values of m, m 0. Describe the apparent relationship bet tween the graphs of the two equations. Applications 33. Investing. An investor has $300,000 to invest. If part is in- vested at 5% and the rest at 9%, how much should be inves at 5% to yield 8% on the total amount? 34. Break-even analysis. A producer of educational DVDs is producing an instructional DVD. She estimates that it will co $90,000 to record the DVD and $5.10 per unit to copy and di tribute the DVD. If the wholesale price of the DVD is $14.70 how many DVDs must be sold for the producer to break even 35. Sports medicine. A simple rule of thumb for determining your maximum safe heart rate (in beats per minute) is to su tract your age from 220. While exercising, you should mais tain a heart rate between 60% and 85% of your maximum safe rate. (A) Find a linear model for the minimum heart rate in that person of age x years should maintain while exercising (B) Find a linear model for the maximum heart rate M that person of age x years should maintain while exercising (C) What range of heartbeats should you maintain while e ercising if you are 20 years old? (D) What range of heartbeats should you maintain while e ercising if you are 50 years old? 36. Linear depreciation. A bulldozer was purchased by a con struction company for $224,000 and has a depreciated valu of $100,000 after 8 years. If the value is depreciated linearl from $224,000 to $100,000, (A) Find the linear equation that relates value V (in dollars to time / (in years). (B) What would be the depreciated value after 12 years? 37. Business Pricing. A sporting goods store sells tennis rack that cost $130 for $208 and court shoes that cost $50 for $80 (A) If the markup policy of the store for items that cost over $10 is linear and is reflected in the pricing of these two items, write an equation that expresses retail price R in terms of cost C. (B) What would be the retail price of a pair of in-line skates that cost $120? (C) What would be the cost of a pair of cross-country skis that had a retail price of $176? (D) What is the slope of the graph of the equation found in part (A)? Interpret the slope relative to the problem. Income. A salesperson receives a base salary of $400 per week and a commission of 10% on all sales over $6,000 dur- ing the week. Find the weekly earnings for weekly sales of $4.000 and for weekly sales of $10,000. 39 Price-demand. The weekly demand for mouthwash in a chain of drug stores is 1,160 bottles at a price of $3.79 each. If the price is lowered to $3.59, the weekly demand increases to 1.320 bottles. Assuming that the relationship between the weekly demandx and price per bottle p is linear, express pin terms of x. How many bottles would the stores sell each week if the price were lowered to $3.297 Freezing temperature. Methanol, also known as wood alco- hol, can be used as a fuel for suitably equipped vehicles, Table 1 lists the freezing temperature for various concentrations (as) a percentage of total weight) of methanol in water. A linear regression model for the data in Table 1 is T-40-2M where M is the percentage of methanol in the solution and T is the temperature at which the solution freezes. Methanol (%Wt) 0 10 20 30 40 50 60 Sce: Ashland Inc. Freezing temperature (°F) 32 20 0 -15 -40 -65 -95 (A) Draw a scatter plot of the data and a graph of the model. on the same axes. (B) Use the model to estimate the freezing temperature to the nearest degree of a solution that is 35% methanol. C) Use the model to estimate the percentage of methanol in a solution that freezes at -50°F. 41. High school dropout cates. Table 2 gives U.S. high school dropout rates as percentages for selected years since 1980. A linear regression model for the data is r=-0.198 +14.2 where i represents years since 1980 and r is the dropout rate. Table 2 High School Dropout Rates (%) 1980 1995 2000 1985 1990 12.1 12.6 14.1 12.0 10.9 (A) Interpret the slope of the model. (B) Draw a scatter plot of the data and the model in the same coordinate system. (C) Use the model to predict the first year for which the dropout rate is less than 5%. Table 3 Consumer Price Index (1982-1984 = 100) Year 2000 2002 2004 2006 2008 2010 Source: U.S. Bureau of Labor Statistics 42. Consumer Price Indes. The U.S. Consumer Price Index (CPI) in recent years is given in Table 3. A scatter plot of the data and linear regression line are shown in the figure, where a represents years since 2000. Height (ft) (A) Interpret the slope of the model. (B) Predict the CPI in 2024. 250 200 15.0 Review Exercises CPI 172.2 179.9 10.0 188.9 198.3 (A) Interpret the slope of the model. (B) What is the effect of a 1-in, increase in Dbh? 5.0 211.1 218.1 43. Forestry. The figure contains a scatter plot of 20 data points for white pine trees and the linear regression model for this data. 0.0 GD (C) Estimate the height of a white pine tree with a Dbh of 25 in. Round your answer to the nearest foot. (D) Estimate the Dbh of a white pine tree that is 15 ft tall. Round your answer to the nearest inch. 50 2005 2010 9.4 7.4 14.758 171 X=0 7-074-2.03 10.0 15.0 Obh (in) 171 41 200 25.0 N 30.0 Applications 85. Price-demand. A company manufactures memory chips for microcomputers. Its marketing research department, using sta tistical techniques, collected the data shown in Table 8, where p is the wholesale price per chip at which x million chips. can be sold. Using special analytical techniques (regression analysis), an analyst produced the following price-demand function to model the data: p(x) = 75-3x 1 x 20 Table Price-Demand * (millions) 1 4 9 14 20 p ($) 72 (A) Plot the data points in Table 8, and sketch a graph of the price-demand function in the same coordinate system. 87. Revenue. (B) What would be the estimated price per chip for a demand of 7 million chips? For a demand of 11 million chips? Table Price-Demand x (thousands) 8 63 86. Price-demand. A company manufactures notebook comput- ers. Its marketing research department, using statistical tech- niques, collected the data shown in Table 9, where p is the wholesale price per computer at which thousand computers can be sold. Using special analytical techniques (regression analysis), an analyst produced the following price-demand function to model the data: p(x)=2,000-60x 1 ≤x≤ 25 16 48 21 25 33 15 (A) Plot the data points in Table 9, and sketch a graph of the price demand function in the same coordinate system. p(S) 1,940 1,520 1,040 740 500 (B) What would be the estimated price per computer for a demand of 11,000 computers? For a demand of 18,000 computers? (A) Using the price-demand function p(x)=75-3x 1≤x≤ 20 from Problem 85, write the company s revenue function and indicate its domain. (B) Complete Table 10, computing revenues to the nearest million dollars. 88. Revenue. Table 10 Revenue x (millions) 1 4 8 12 16 20 (C) Plot the points from part (B) and sketch a graph of the revenue function using these points. Choose millions for the units on the horizontal and vertical axes. SECTION 2.1 Functions 55 (A) Using the price-demand function p(x)=2,000-60 1≤x≤25 from Problem 86, write the company s revenue function and indicate its domain, (B) Complete Table 11, computing revenues to the nearest thousand dollars. Toblo 11 Revenue x (thousands) 5 10 15 20 25 R(x) (million S) 72 (C) Plot the points from part (B) and sketch a graph of the revenue function using these points. Choose thousands for the units on the horizontal and vertical axes. 89. rofit. The financial department for the company in Problems 85 and 87 established the following cost function for producing and selling x million memory chips: C(x) = 125+ 16x million dollars (A) Write a profit function for producing and selling. million memory chips and indicate its domain. Table 12 Profit x (millions) 4 8 R(x) (thousand $) 1,940 (B) Complete Table 12, computing profits to the nearest million dollars. 12 16 20 P(x) (million $) -69 (C) Plot the points in part (B) and sketch a graph of the profit function using these points 56 CHAPTER 2 Functions and Graphs 90. Profit. The financial department for the company in Problems 86 and 88 established the following cost function for producing and selling x thousand notebook computers: C(x) = 4,000 + 500x thousand dollars (A) Write a profit function for producing and selling thousand notebook computers and indicate its domain. (B) Complete Table 13, computing profits to the nearest thousand dollars. C Table 13 Profit x (thousands) I 52584 10 15 20 (C) Plot the points in part (B) and sketch a graph of the profit function using these points. 91. Packaging. A candy box will be made out of a piece of card- board that measures 8 by 12 in. Equal-sized squares x inches on a side will be cut out of each comer, and then the ends and sides will be folded up to form a rectangular box. P(x) (thousand $) -2,560 (A) Express the volume of the box V(x) in terms of .x. (B) What is the domain of the function V (determined by the physical restrictions)? (C) Complete Table 14. Table 14 Volume * 1 3 Be Chiclan 92. Packaging Refer to Problem 91. V(x) (D) Plot the points in part (C) and sketch a graph of the vol- ume function using these points. (A) Table 15 shows the volume of the box for some values of x between 1 and 2. Use these values to estimate to one decimal place the value of x between 1 and 2 that would produce a box with a volume of 65 cu. in. Table 15 Volume x 1.1 1.2 1.3 1.4 1.5 1.6 1.7 (B) Describe how you could refine this table to estimate x to two decimal places. (C) Carry out the refinement you described in part (B) and approximate x to two decimal places. 93. Packaging. Refer to Problems 91 and 92. (A) Examine the graph of V(x) from Problem 91D and discuss the possible locations of other values of x that would produce a box with a volume of 65 cu. in. (B) Construct a table like Table 15 to estimate any such value to one decimal place. V(x) 62.524 64.512 (C) Refine the table you constructed in part (B) to provide an approximation to two decimal places. Length 1 65.988 66.976 67.5 94. Packaging A parcel delivery service will only deliver pack- ages with length plus girth (distance around) not exceeding 108 in. A rectangular shipping box with square ends x inches on a side is to be used. 67.584 67.252 X MC Table 16 Volume Girth (A) If the full 108 in. is to be used, express the volume of the box V(x) in terms of x. 5 (B) What is the domain of the function V (determined by the physical restrictions)? (C) Complete Table 16. 10 15 20 25 V(x) (D) Plot the points in part (C) and sketch a graph of the vol- ume function using these points.
Expert Answer:
Related Book For
Income Tax Fundamentals 2013
ISBN: 9781285586618
31st Edition
Authors: Gerald E. Whittenburg, Martha Altus Buller, Steven L Gill
View Solution
Create a free account to access the answer
Cannot find your solution?
Post a FREE question now and get an answer within minutes.
* Average response time.
Posted Date: June 24, 2022 06:24:27
Related Video
In everyday life, it sometimes becomes a hassle to park a car in the mall’s parking lot. Usually, it’s difficult to find a convenient location where the car can easily be seen while leaving the mall after shopping.