

Question: solve The data on this graph represents the number of sales for several types of vehicles in 2015. Which vehicle represents the mode? Number of
solve
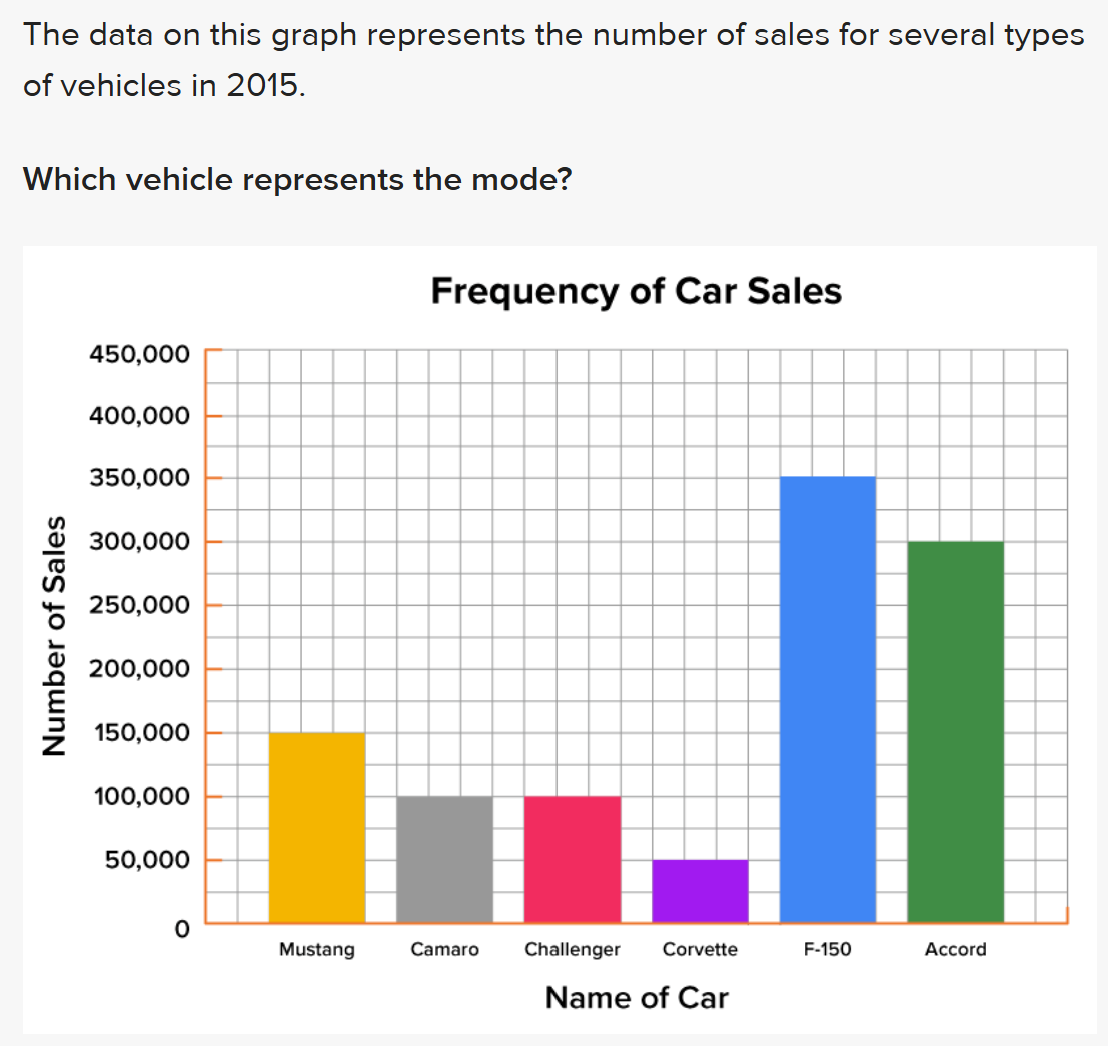 The data on this graph represents the number of sales for several types of vehicles in 2015. Which vehicle represents the mode? Number of Sales 450,000 400,000 350,000 300,000 250,000 200,000 150,000 100,000 50,000 0 Frequency of Car Sales Mustang Camaro Challenger Corvette Name of Car | | | | F-150 Accord
Step by Step Solution
There are 3 Steps involved in it
1 Expert Approved Answer
Step: 1 Unlock

Question Has Been Solved by an Expert!
Get step-by-step solutions from verified subject matter experts
Step: 2 Unlock
Step: 3 Unlock