

Question: Solve the drilling problem Attached is a problem dealing with a drilling operation (time can be measured). Please note the # of sample periods and
Solve the drilling problem 
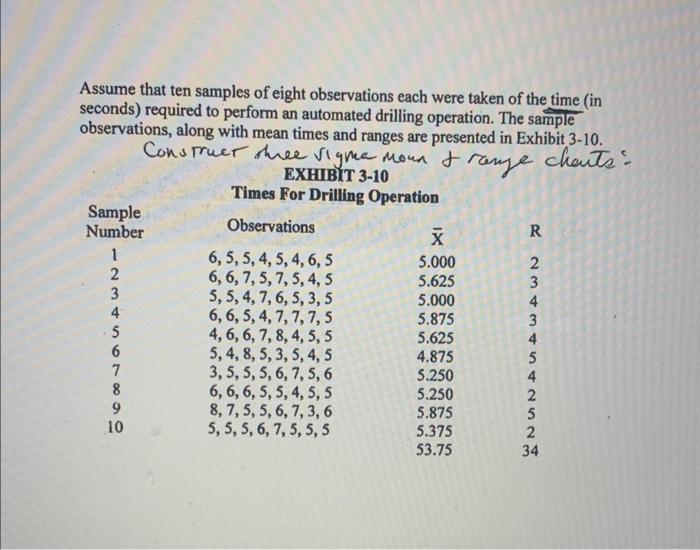
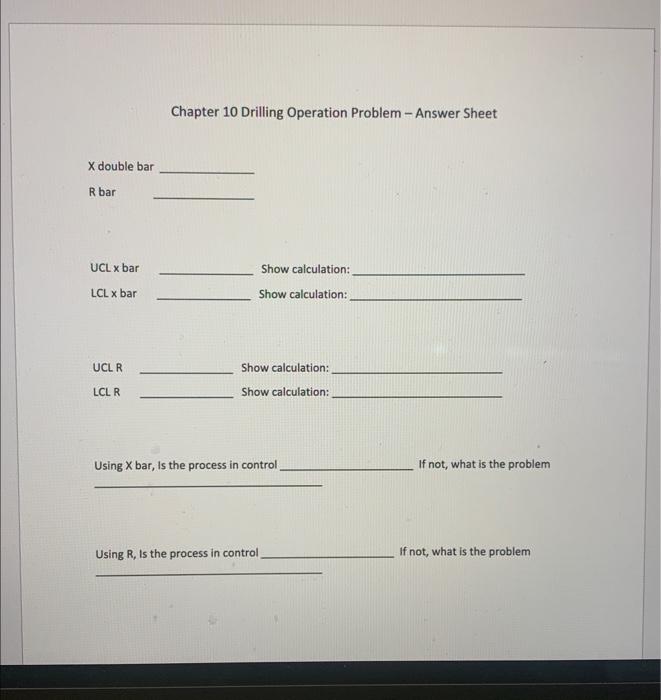
Attached is a problem dealing with a drilling operation (time can be measured). Please note the # of sample periods and # of observations in each sample period. The data is presented horizontally instead of Vertically. Xbar (mean/avg) and R (dispersion) are done for you for each sample period, You need to calculate X double bar and R bar, determine Upper and Lower control limits, and determine if the operation is in control looking at average (Xbar) and dispersion (R). Put your answers on the answer sheet and upload into Canvas, Assume that ten samples of eight observations each were taken of the time (in seconds) required to perform an automated drilling operation. The sample observations, along with mean times and ranges are presented in Exhibit 3-10. Chapter 10 Drilling Operation Problem - Answer Sheet X double bar R bar UCL bar Show calculation: LCL bar Show calculation: UCL R Show calculation: LCL. R Show calculation: Using X bar, is the process in control If not, what is the problem Using R, Is the process in control If not, what is the Step by Step Solution
There are 3 Steps involved in it
1 Expert Approved Answer
Step: 1 Unlock

Question Has Been Solved by an Expert!
Get step-by-step solutions from verified subject matter experts
Step: 2 Unlock
Step: 3 Unlock