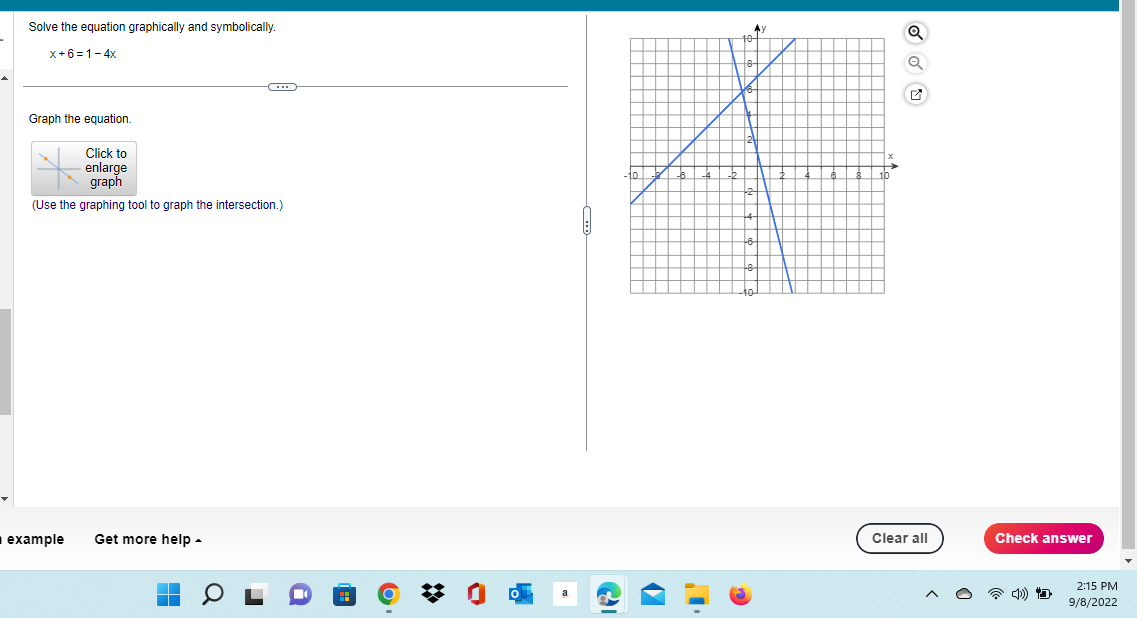
Question: Solve the equation graphically and symbolically. X +6=1 -4x Graph the equation. Click to X enlarge graph (Use the graphing tool to graph the intersection.)

Solve the equation graphically and symbolically.Solve the equation graphically and symbolically.Solve the equation graphically and symbolically.
Solve the equation graphically and symbolically. X +6=1 -4x Graph the equation. Click to X enlarge graph (Use the graphing tool to graph the intersection.) example Get more help - Clear all Check answer OLDBO 2:15 PM a 9/8/2022on 2.2 Homework Question 22, 2.2.115 HW Score: 68.97%, 20 of 29 points O Points: 0 of 1 Save The per capita (per person) income from 1985 to 2010 can be modeled by K f(x) = 2000(x - 1985) + 10,000 where x is the year. Determine the year when the per capita income was $14,000. The per capita income was $14,000 in the year View an example Get more help - Clear all Check answer OLDBOX 2:15 PM 9/8/20222.2 Homework Question 23, 2.2.117 HW Score: 68.97%, 20 of 29 points O Points: 0 of 1 Save During the 1980s, sales of compact discs surpassed record sales. From 1985 to 1990 K sales of compact discs in millions can be modeled by the formula f(x) = 48.3(x -1985) +7.3, whereas sales of LP records in millions can be modeled by g(x) = - 33.7(x -1985) + 48.3. Approximate the year x when sales of LP records and compact discs were equal by using the intersection-of-graphs method. Each had equal sales in the year] (Round to the nearest whole number as needed.) w an example Get more help - Clear all Check answer OLDBO 2:15 PM 9/8/2022

Step by Step Solution

There are 3 Steps involved in it

1 Expert Approved Answer
Step: 1 Unlock blur-text-image
Question Has Been Solved by an Expert!

Get step-by-step solutions from verified subject matter experts

Step: 2 Unlock
Step: 3 Unlock

Students Have Also Explored These Related Mathematics Questions!