

Question: solve The following data lists the grades students got on a recent exam: 74, 42, 74, 67, 85, 57, 86, 72, 83, 75, 99, 77,
solve
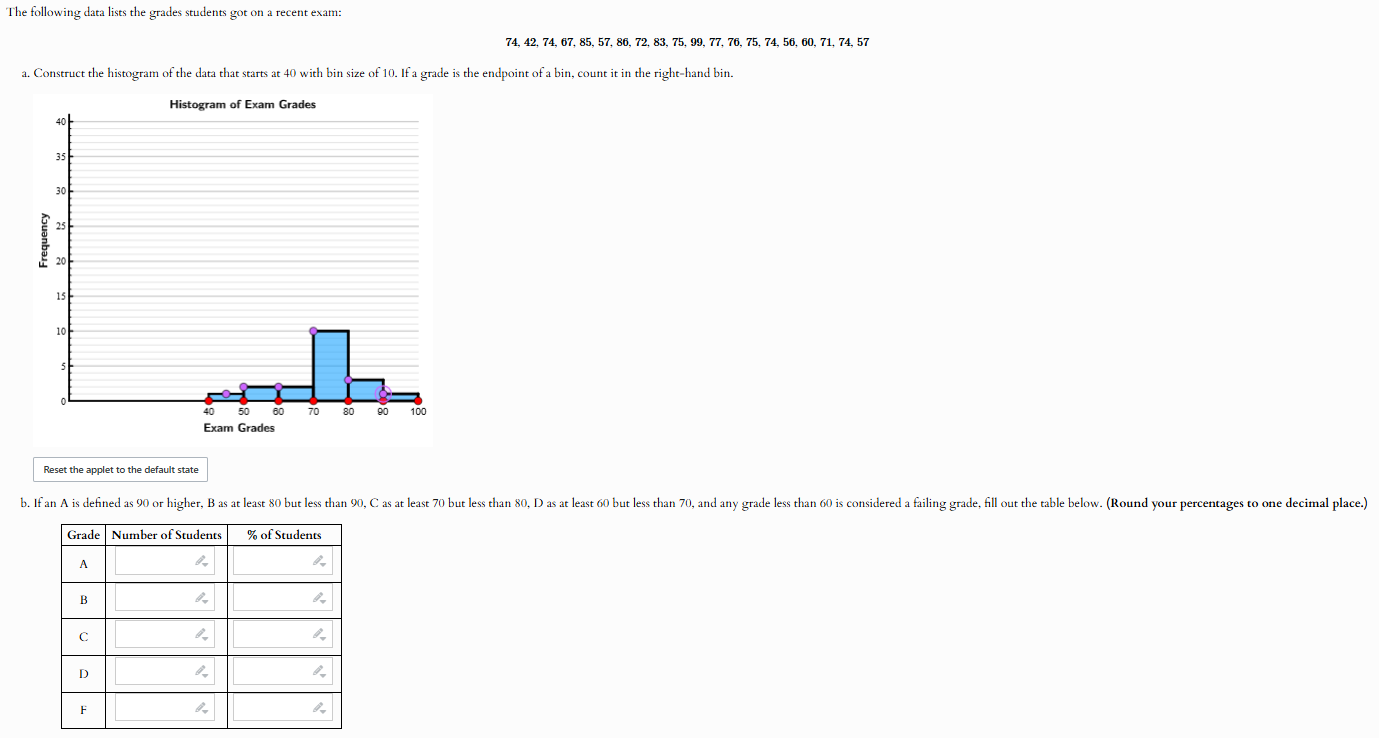 The following data lists the grades students got on a recent exam: 74, 42, 74, 67, 85, 57, 86, 72, 83, 75, 99, 77, 76, 75, 74, 56, 60, 71, 74, 57 a. Construct the histogram of the data that starts at 40 with bin size of 10. If a grade is the endpoint of a bin, count it in the right-hand bin. Histogram of Exam Grades 40 35 30 25 Frequency 15 10 0O 40 50 60 70 80 90 100 Exam Grades Reset the applet to the default state b. If an A is defined as 90 or higher, B as at least 80 but less than 90, C as at least 70 but less than 80, D as at least 60 but less than 70, and any grade less than 60 is considered a failing grade, fill out the table below. (Round your percentages to one decimal place.) Grade | Number of Students % of Students D F
Step by Step Solution
There are 3 Steps involved in it
1 Expert Approved Answer
Step: 1 Unlock

Question Has Been Solved by an Expert!
Get step-by-step solutions from verified subject matter experts
Step: 2 Unlock
Step: 3 Unlock