

Question: Solve the following examples using and calculate/draw: Draw the timeline (Gant chart for each process Calculate the waiting time of each process Calculate the average
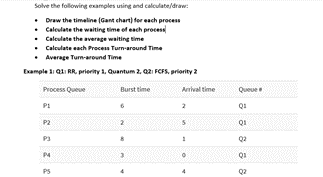
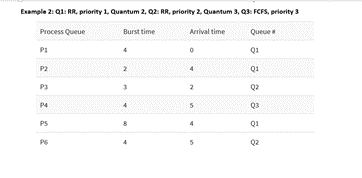
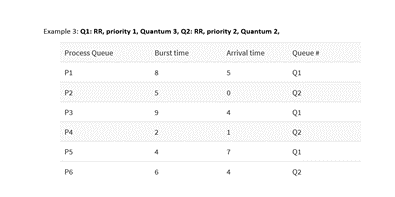
Solve the following examples using and calculate/draw: Draw the timeline (Gant chart for each process Calculate the waiting time of each process Calculate the average waiting time Calculate each Procen Turn-around Time Average Turn-around Time Bample 13011 RR. priority 1. Quantum 2.021 FCFS, priority 2 Process Queue Burst time Arthaltime P: 2 Queue P2 2 5 P3 8 8 8 8 8 PM PS Example 2:01: RA, priority 1, Quantum 2, Q2: RR, priority 2. Quantum 3, Q3: FCFS, priority 3 Process Queue Burst time Arrival time Quece P1 P2 2 Q1 P3 2 Pe 4 S 03 PS Q1 PS 02 Example 3:01: RR. priority 1. Quantum 3, Q21 RR priority 2. Quantum 2. Process Queue Burst time Arrival time Queue P1 5 Q1 P2 5 0 Q2 P3 9 Q1 P4 2 1 02 Q1 P5 7 Q2
Step by Step Solution
There are 3 Steps involved in it

Get step-by-step solutions from verified subject matter experts