

Question: Solve the following problems Question 1 Calculate the 25th percentile of the data shown. Compute this by hand (NOT using technology) as shown in class.
Solve the following problems
Question 1
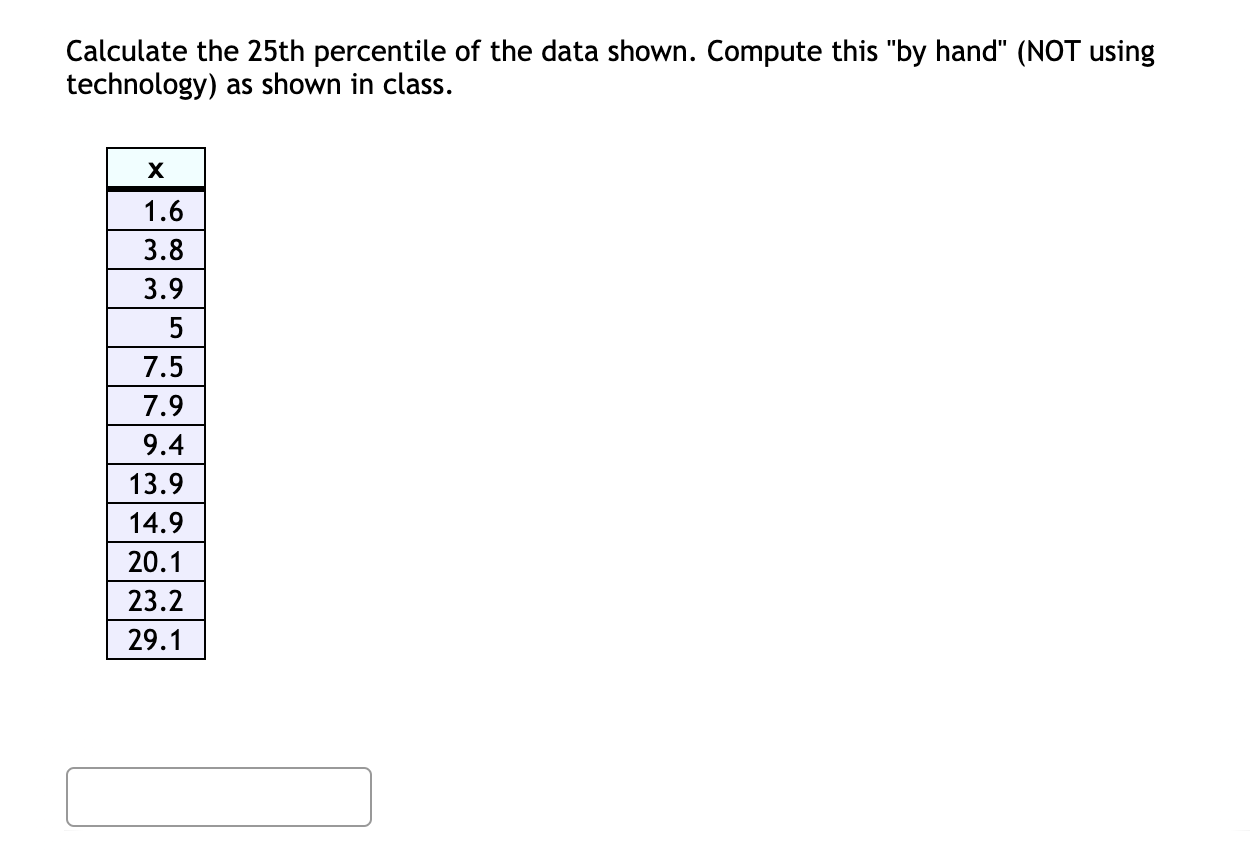
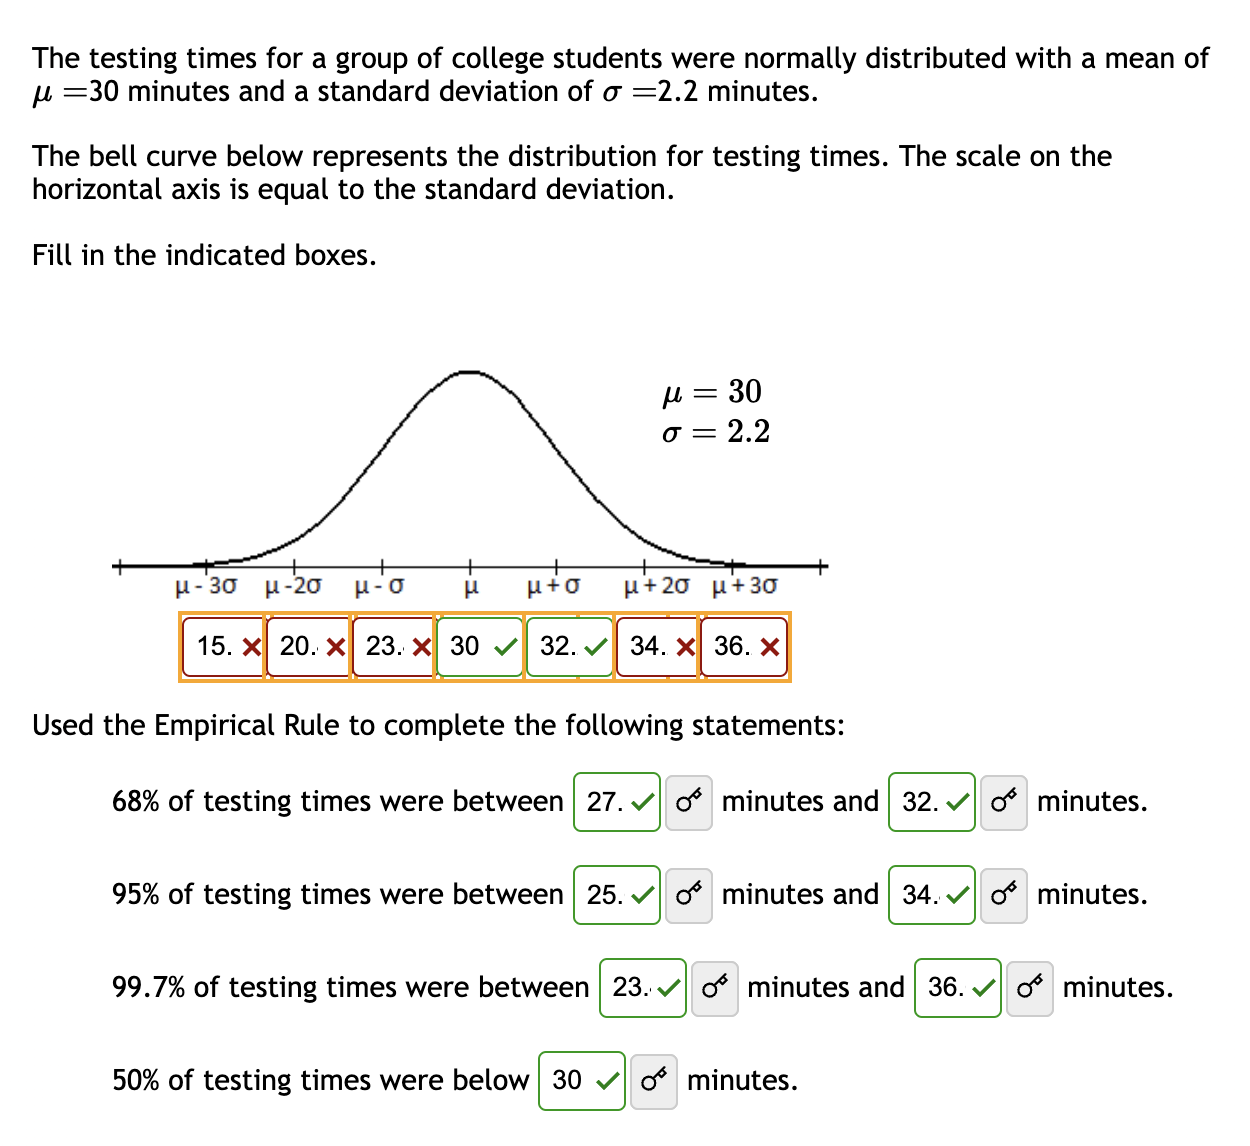
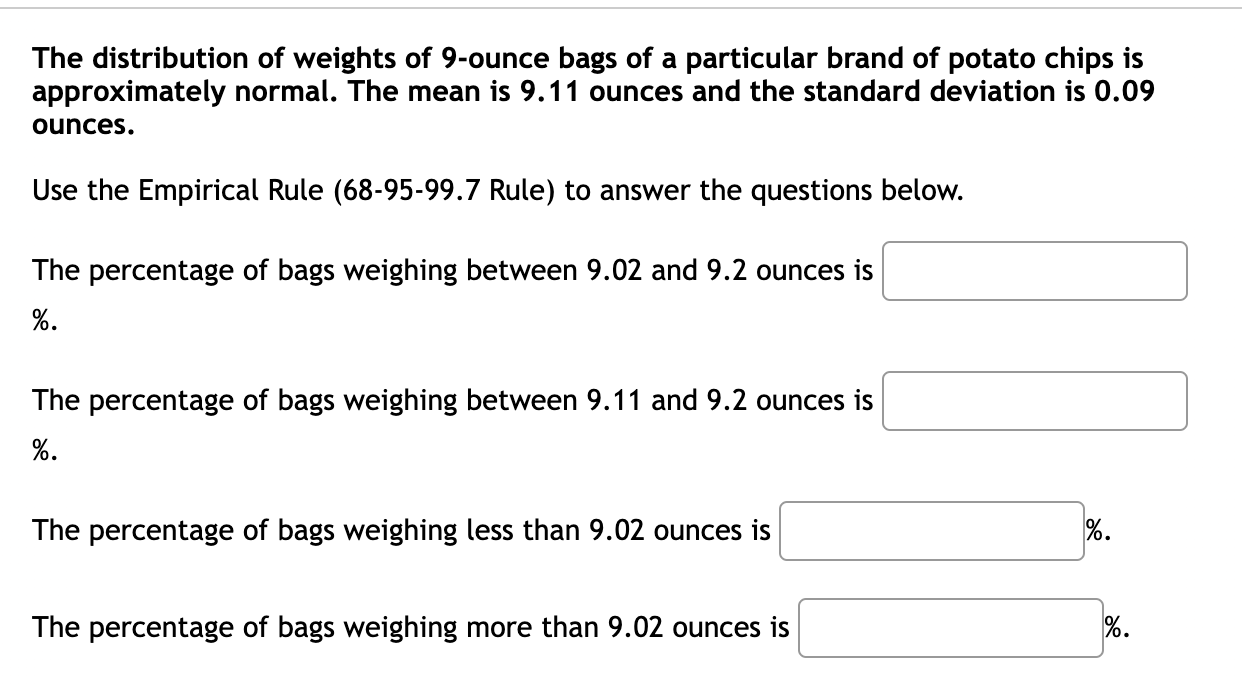
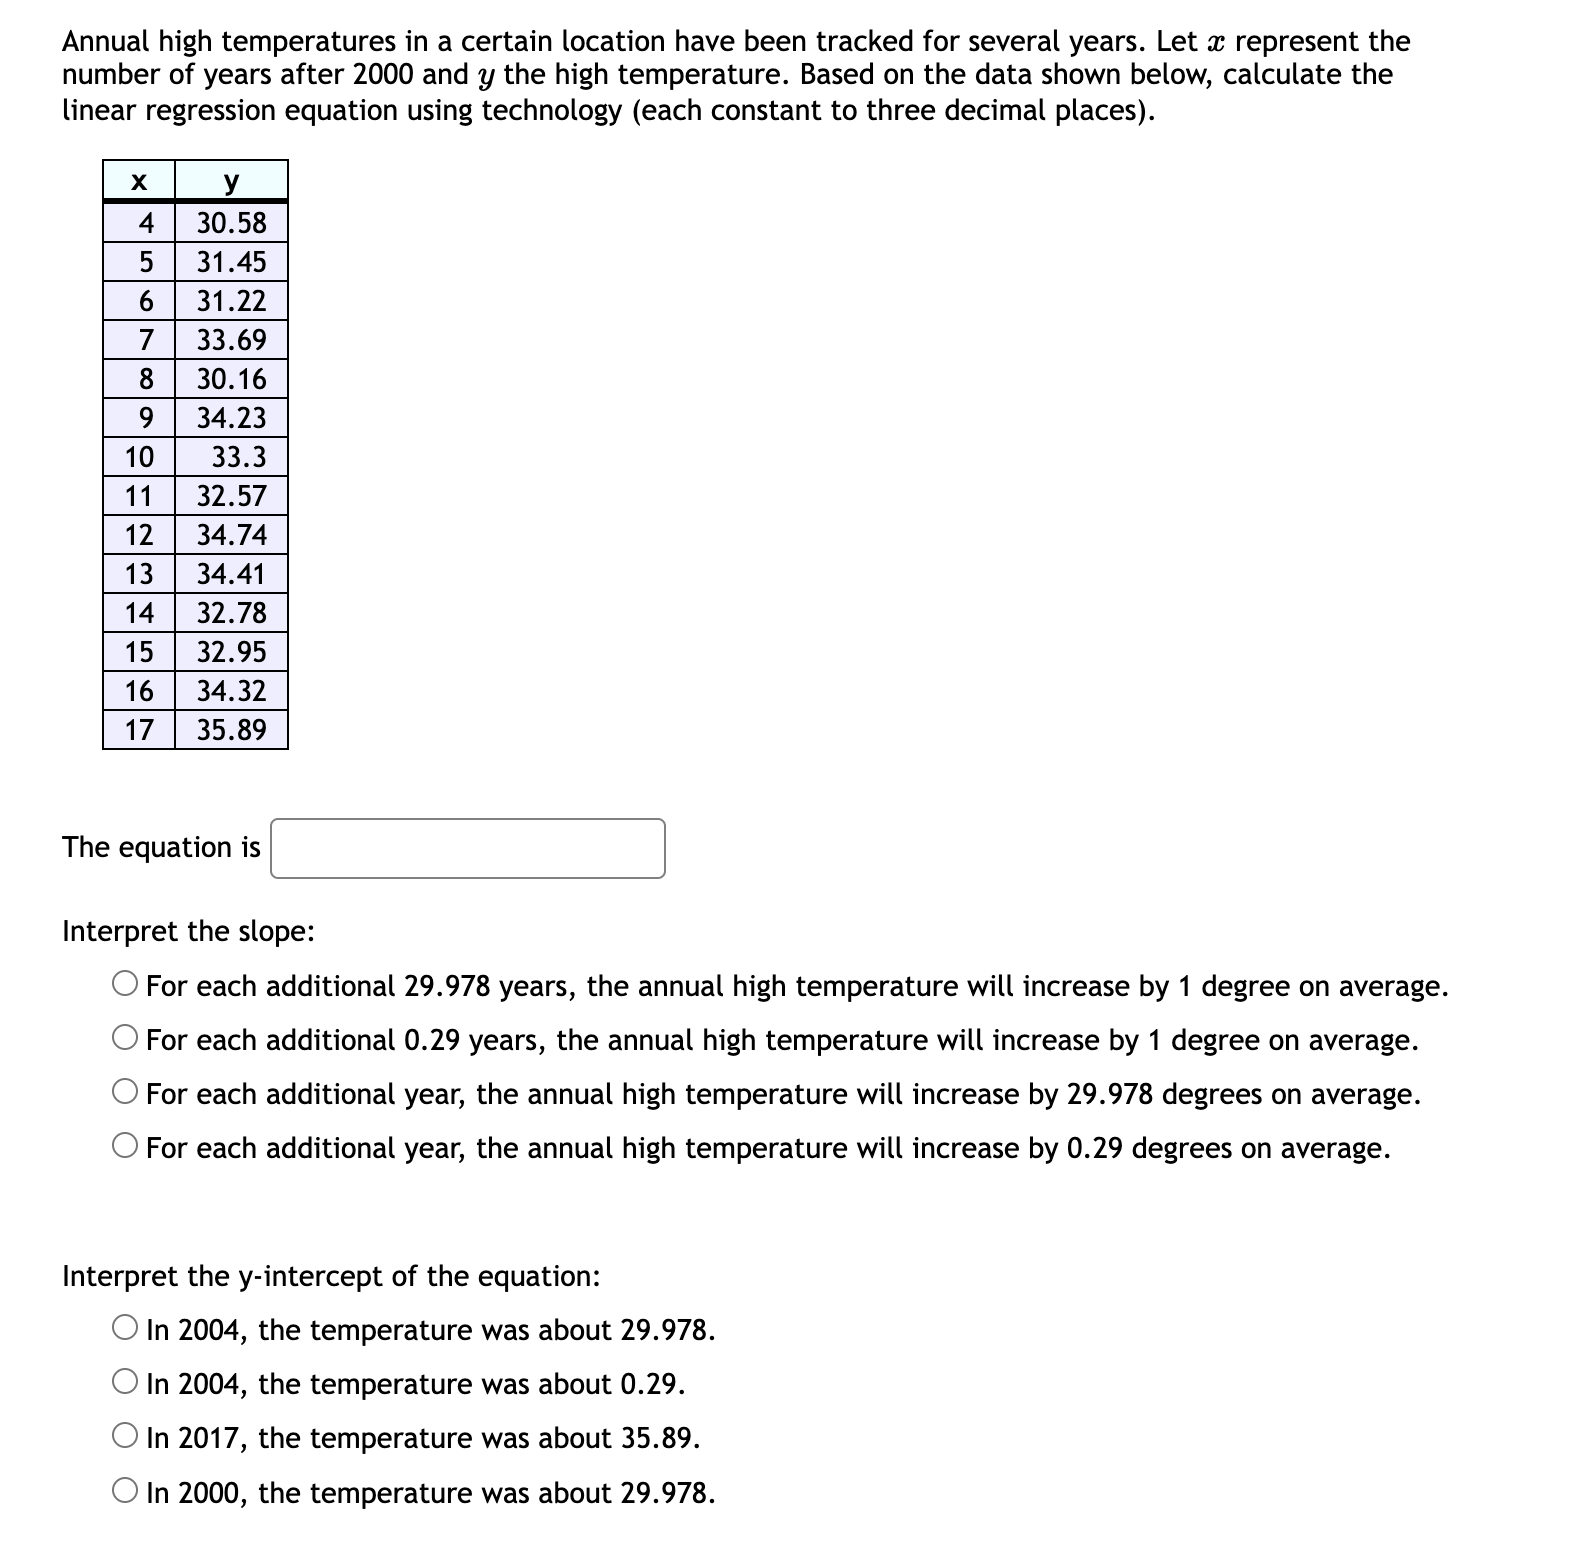
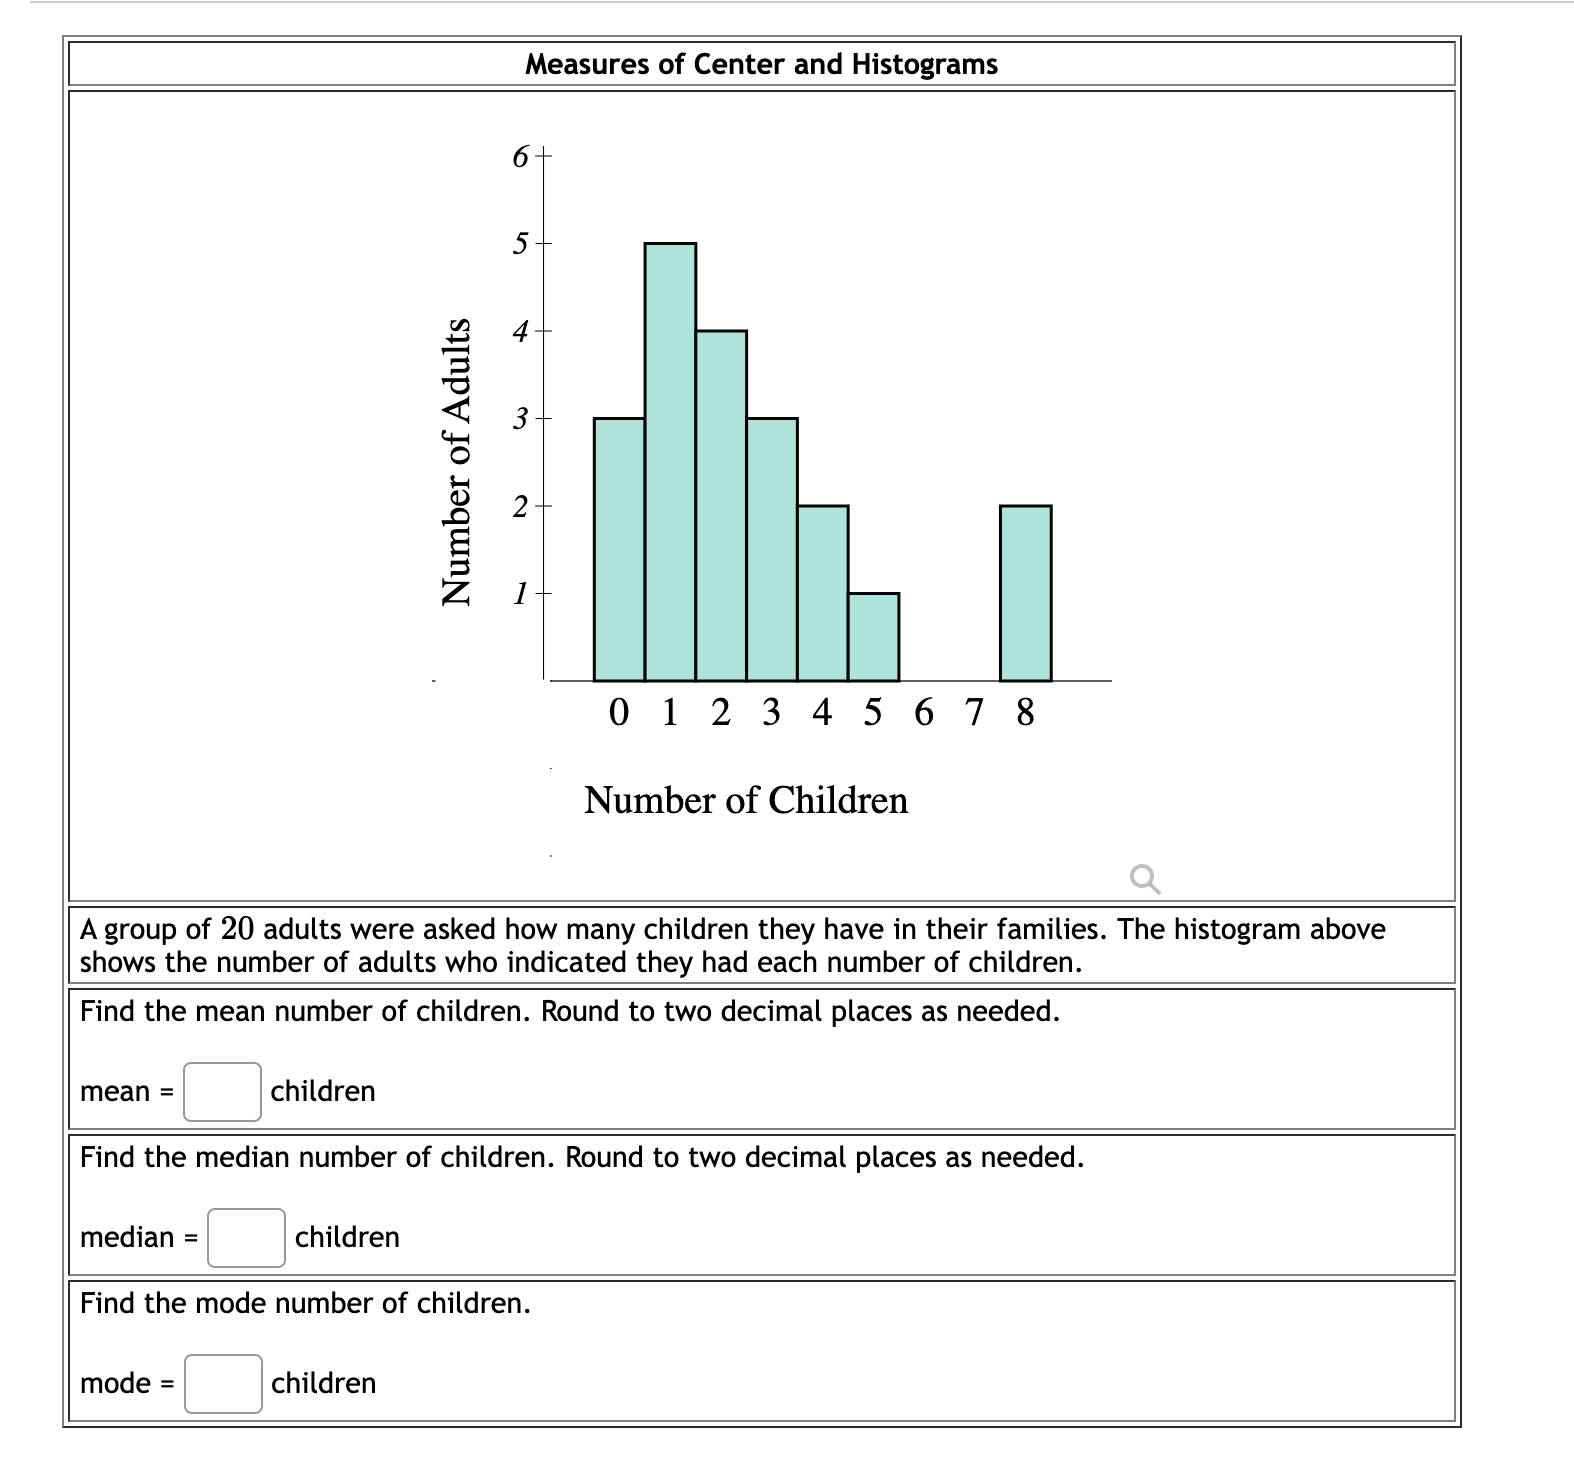
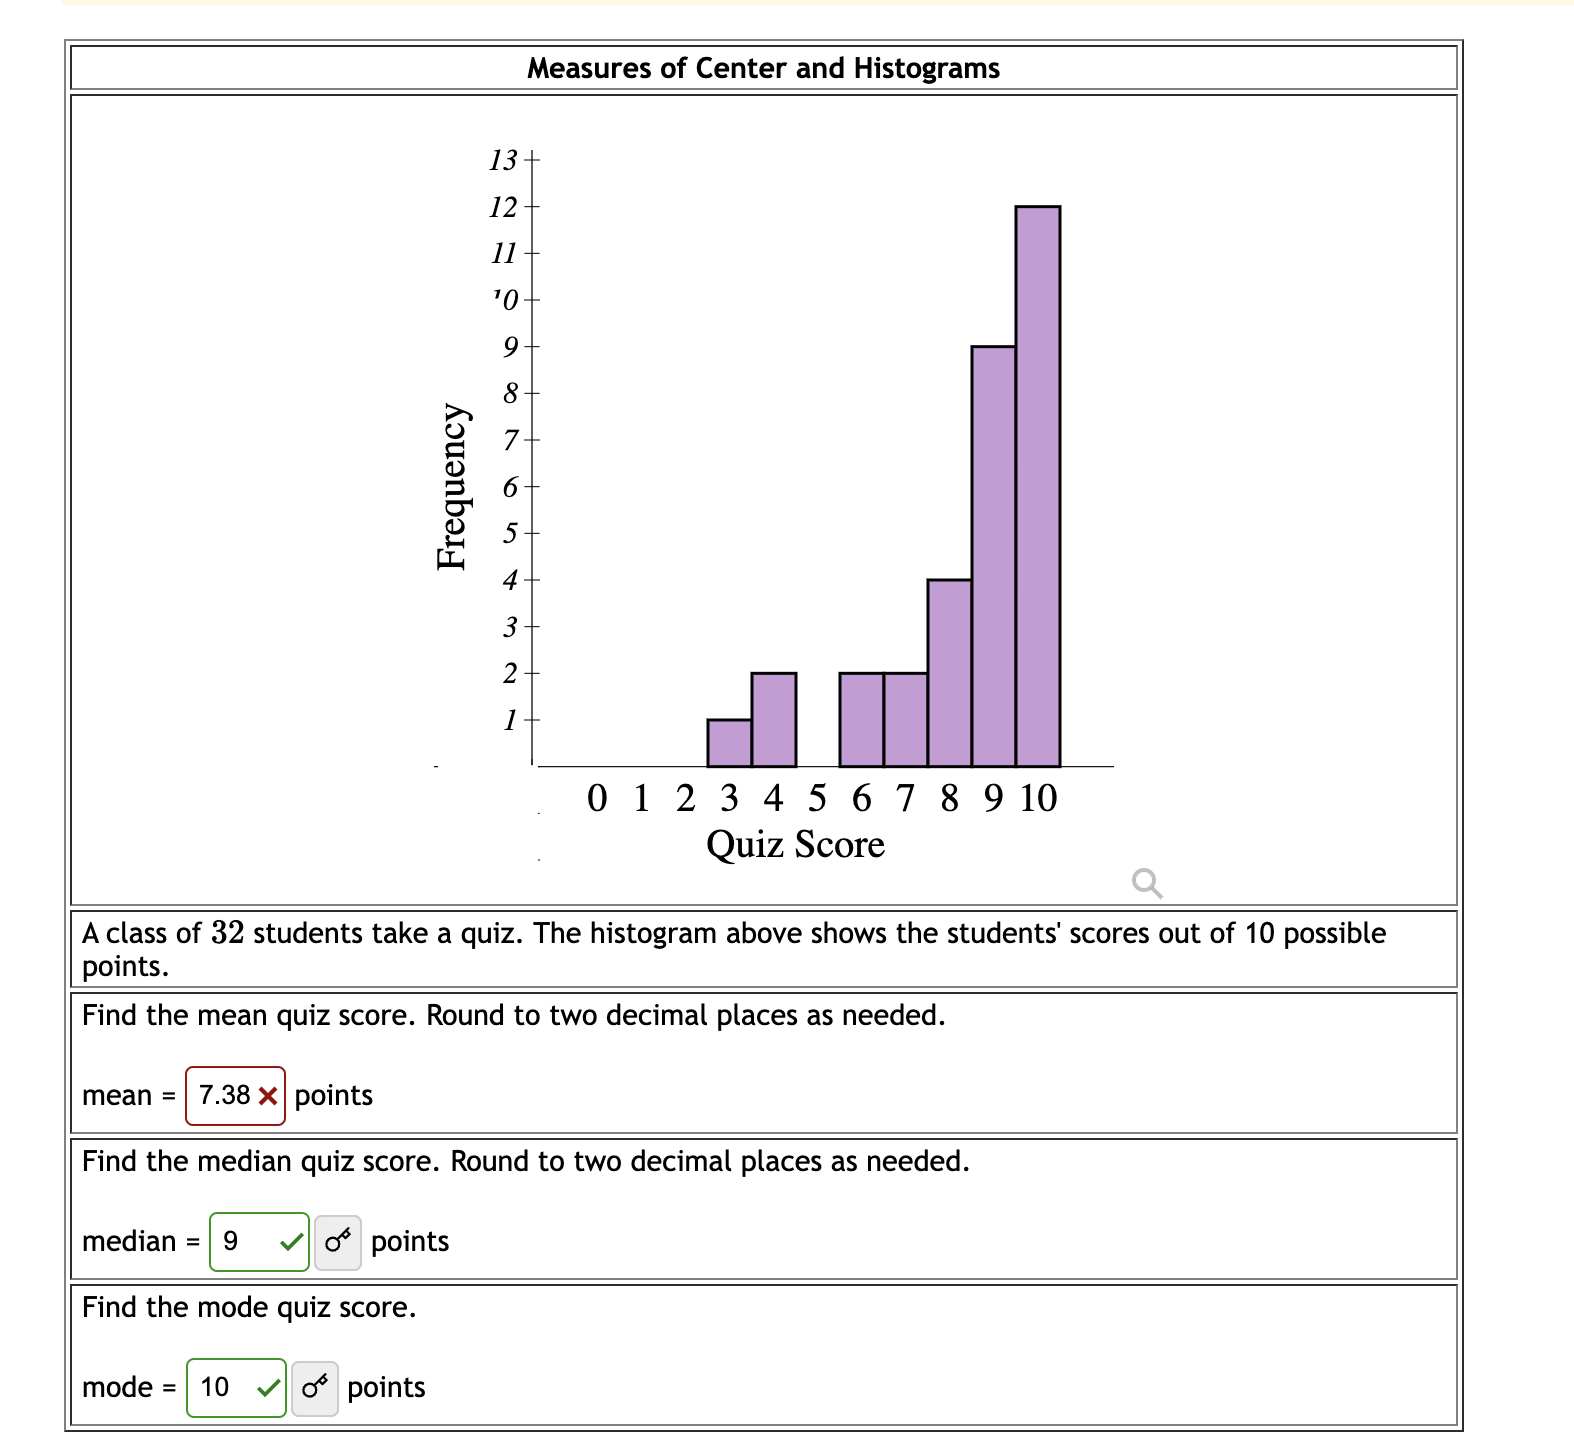
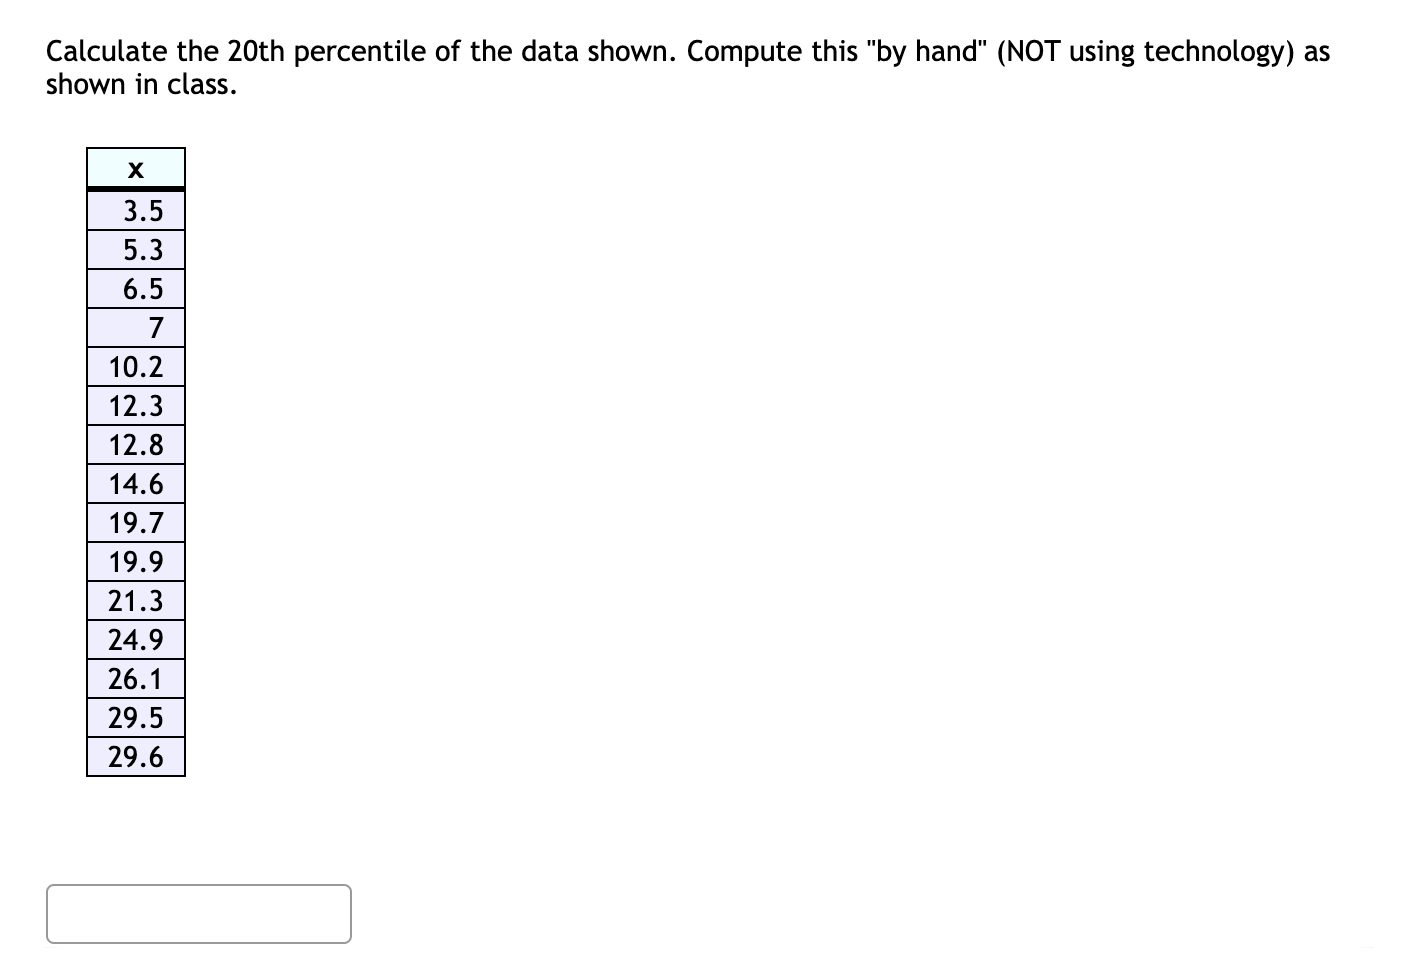
Calculate the 25th percentile of the data shown. Compute this "by hand\" (NOT using technology) as shown in class. The testing times for a group of college students were normally distributed with a mean of p =30 minutes and a standard deviation of o =2.2 minutes. The bell curve below represents the distribution for testing times. The scale on the horizontal axis is equal to the standard deviation. Fill in the indicated boxes. H-30 pn-20 p-0 p+0o H+20 p+30 '15)('20 23)('30\\/ 32'34 E Used the Empirical Rule to complete the following statements: 68% of testing times were between o minutes and o minutes. 95% of testing times were between o minutes and minutes. 99.7% of testing times were between minutes and minutes. 50% of testing times were below o minutes. The distribution of weights of 9-ounce bags of a particular brand of potato chips is approximately normal. The mean is 9.11 ounces and the standard deviation is 0.09 ounces. Use the Empirical Rule (68-95-99.7 Rule) to answer the questions below. The percentage of bags weighing between 9.02 and 9.2 ounces is %. The percentage of bags weighing between 9.11 and 9.2 ounces is %. The percentage of bags weighing less than 9.02 ounces is %. The percentage of bags weighing more than 9.02 ounces is %. Annual high temperatures in a certain location have been tracked for several years. Let x represent the number of years after 2000 and y the high temperature. Based on the data shown below, calculate the linear regression equation using technology (each constant to three decimal places). ES | 5| 31.45 | | 6| 31.22 | | 8| 30.16 | | 9| 34.23 | Interpret the slope: O For each additional 29.978 years, the annual high temperature will increase by 1 degree on average. O For each additional 0.29 years, the annual high temperature will increase by 1 degree on average. O For each additional year, the annual high temperature will increase by 29.978 degrees on average. O For each additional year, the annual high temperature will increase by 0.29 degrees on average. Interpret the y-intercept of the equation: O In 2004, the temperature was about 29.978. O In 2004, the temperature was about 0.29. O In 2017, the temperature was about 35.89. O In 2000, the temperature was about 29.978. Measures of Center and Histograms v = = o
Step by Step Solution
There are 3 Steps involved in it

Get step-by-step solutions from verified subject matter experts