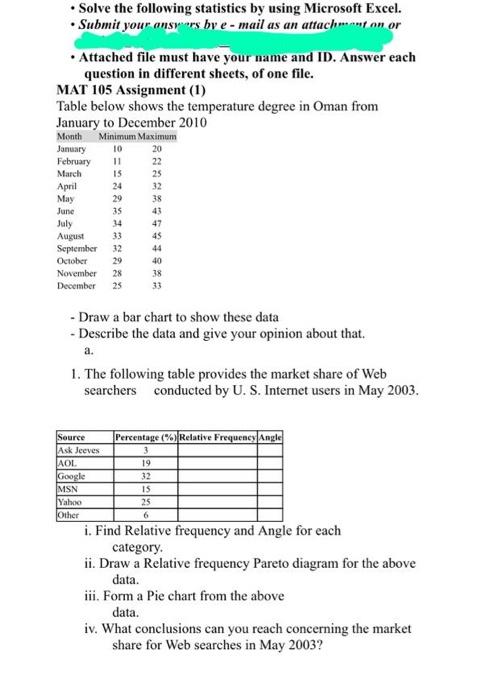
Question: Solve the following statistics by using Microsoft Excel. Submit your answers by e-mail as an attachmut on or Attached file must have your name and

Solve the following statistics by using Microsoft
Solve the following statistics by using Microsoft Excel. Submit your answers by e-mail as an attachmut on or Attached file must have your name and ID. Answer each question in different sheets, of one file. MAT 105 Assignment (1) Table below shows the temperature degree in Oman from January to December 2010 Month Minimum Maximum January 10 20 February 22 March April May June 25 July 11 15 24 29 35 34 33 32 29 28 25 August September October November December 38 43 47 45 44 40 38 33 - Draw a bar chart to show these data - Describe the data and give your opinion about that. a. 1. The following table provides the market share of Web searchers conducted by U. S. Internet users in May 2003. Percentage (%)Relative Frequency Angle Source Ask Jeeves AOL Google MSN Yahoo Other 3 19 32 IS 25 6 i. Find Relative frequency and Angle for each category ii. Draw a Relative frequency Pareto diagram for the above data. iii. Form a Pie chart from the above data. iv. What conclusions can you reach concerning the market share for Web searches in May 2003

Step by Step Solution

There are 3 Steps involved in it

1 Expert Approved Answer
Step: 1 Unlock blur-text-image
Question Has Been Solved by an Expert!

Get step-by-step solutions from verified subject matter experts

Step: 2 Unlock
Step: 3 Unlock

Students Have Also Explored These Related General Management Questions!