

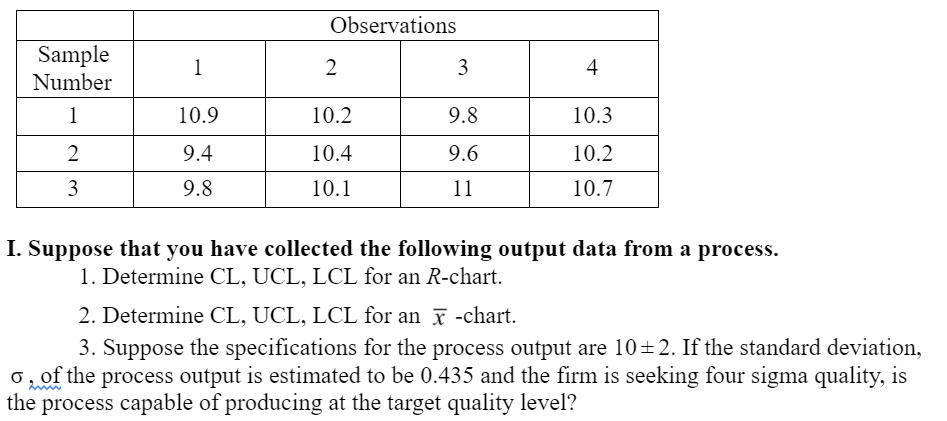
Question: Solve the following two problem sets. Show your work. Observations Sample Number 1 1 2 3 4 1 10.9 10.2 9.8 10.3 2 2 9.4
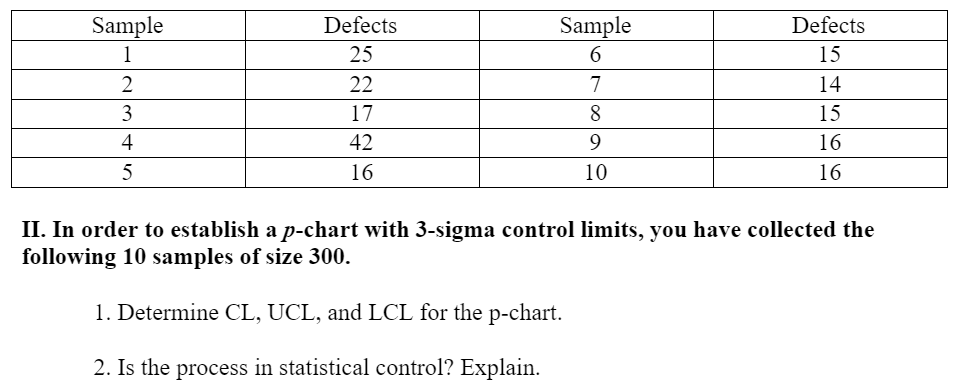
Solve the following two problem sets. Show your work.
Step by Step Solution
There are 3 Steps involved in it
1 Expert Approved Answer
Step: 1 Unlock

Question Has Been Solved by an Expert!
Get step-by-step solutions from verified subject matter experts
Step: 2 Unlock
Step: 3 Unlock