

Question: Solve the given problem using POQ and LTC BACKGROUND OF THE PROBLEM Menon was assigned the task of preparing the operating plan for the next
Solve the given problem using POQ and LTC
BACKGROUND OF THE PROBLEM Menon was assigned the task of preparing the operating plan for the next eight weeks for the product P0110, which was a regular order. P0110 was an assembly of two P0X units and two P0Y units. Each P0X unit required four P1X1 units and three P1X2 units. The final product had a unit price of Rs200. When Menon checked the store inventory, she found 240 P0110 units already in stock. The requirement for the first week was just 400 units, which was easily manageable based on current stock. However, the basic problem Menon faced was not deciding how much to produce to be able to meet the requirements, but deciding how to produce economically, taking into account the forecasted demand of the product. Menon knew that in order to decide, she would have to depend on some techniques and systems that she had learned as a business student. MATERIAL REQUIREMENTS PLANNING
The primary goal of the material requirements planning (MRP) system was to develop a detailed time- phased plan for when to place purchasing orders for raw materials and to determine how much material to
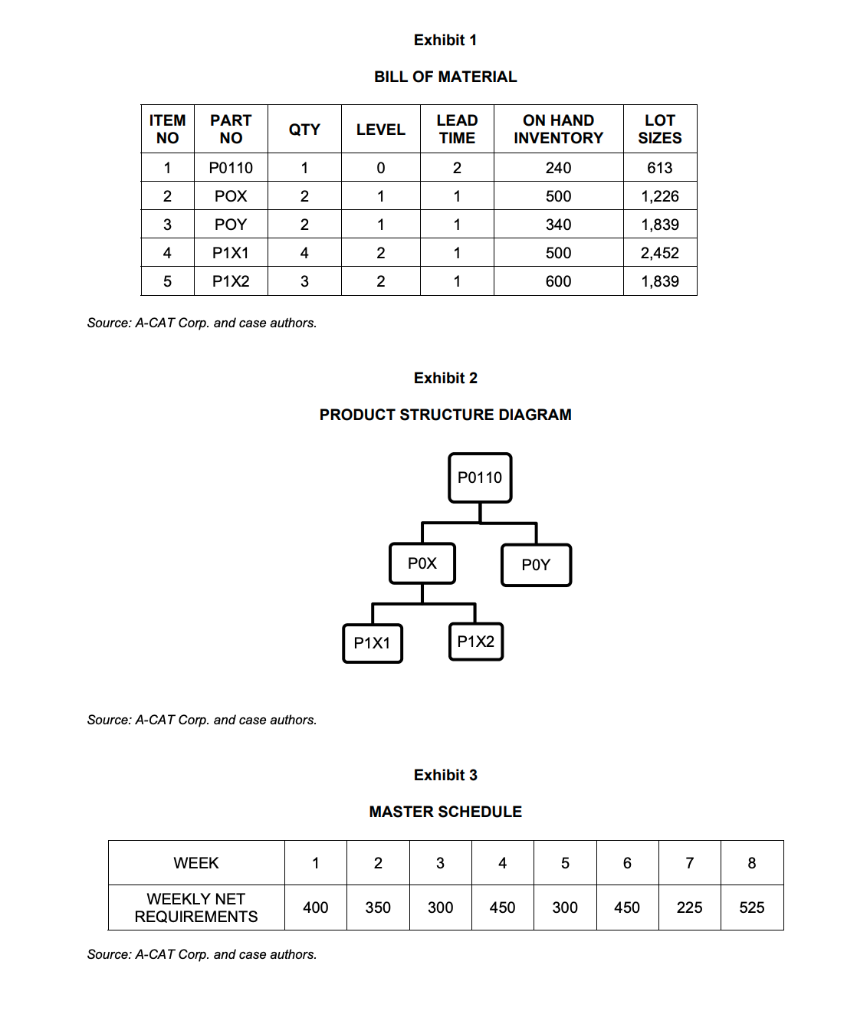
order. The systems effectiveness depended on the inventory position and policies, the bill of materials and the demand requirements for finished goods and components. Bill of Materials Menon prepared the bill of materials, which was a relatively simple task as there were only two components in level one and two more in level two. The final product at the top of the structure is always leveled zero. The level number increases as we move down the product structure. The final product P0110 has three levels of assembly. (see Exhibit 1). As P0110 was a regular product, she did not have to worry about the design aspect. She knew that one unit of P0110 required an assembly of two P0X units and two P0Y units. Each P0X was, in turn, assembled by putting together four units of P1X1 and three units of P1X2. Product Structure Diagram To better explain the product structure diagram she had created, Menon included the levels zero, one and two to indicate the three stages involved in manufacturing P0110: the product assembly department, the sub-assembly section and the machine shop (see Exhibit 2). She added the manufacturing lead times to the diagram required to produce the components; she tried to include the processing time, set-up time, transit time and wait time while computing the lead times. Master Schedule After clearly outlining the product cost structure, the next job at hand for Menon was to prepare the master schedule. This schedule would indicate the number of P0110 units required to be assembled for the next eight weeks. By following the pattern set in earlier master schedules and studying market demand forecasts in detail, Menon was able to finalize a master schedule (see Exhibit 3).
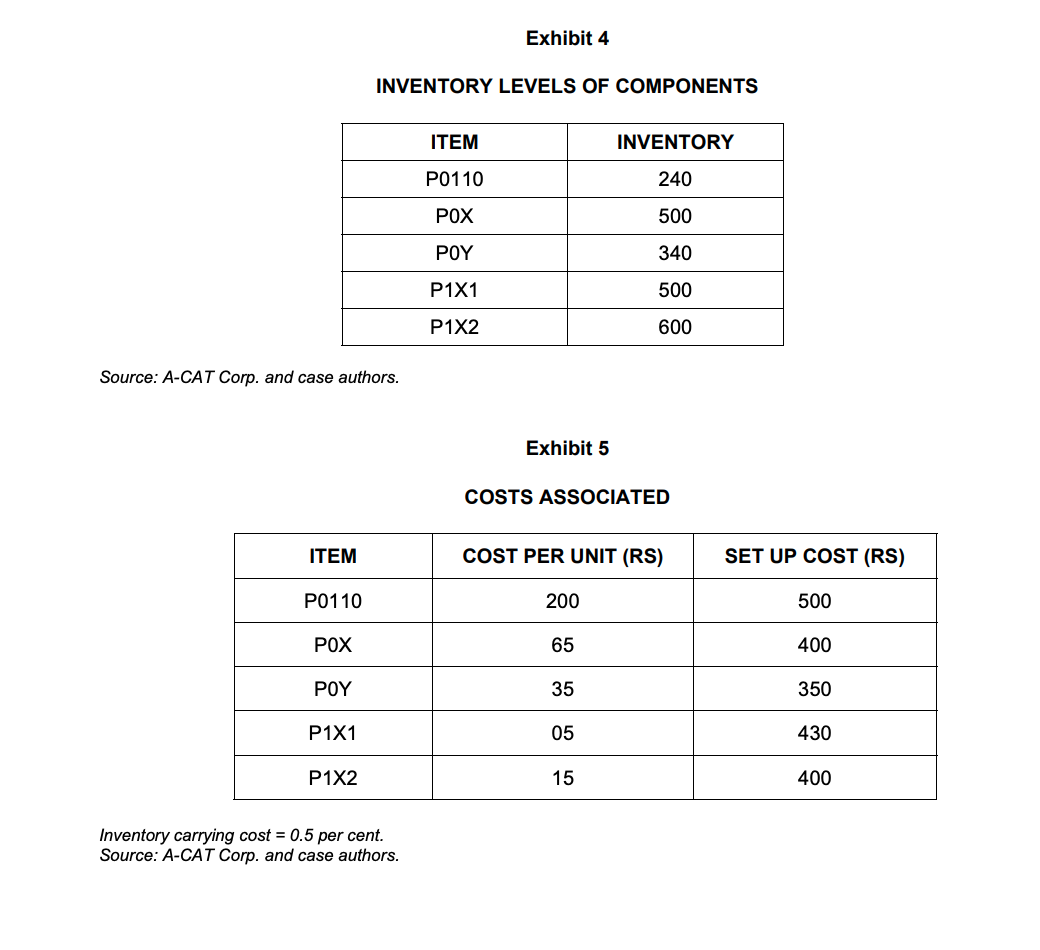
On Hand Inventory A-CAT had witnessed a significant decrease in sales owing to a number of factors that had occurred just before Menon joined the company. This was reflected in higher-than-normal levels of on-hand inventory. As a student of inventory management, Menon was able to relate this element of the problem. She decided to align the on-hand inventory with the demand forecast and develop the method needed to optimize production (see Exhibit 4). Costs Associated With very little time at her disposal, Menon could not calculate the optimum carrying or set-up costs. She instead went to the accounts department and collected records of the current inventory carrying and set-up costs (see Exhibit 5). DILEMMA After collecting all the necessary data and working on the task for five days, Menon reached different solutions by applying different techniques. For every lot-sizing technique that she applied, she reached a different answer. Finally, she decided to send all of her work to a colleague who was skilled in operations management; Menon was now waiting desperately for his call before she received the receptionists nod to enter the boardroom for her meeting with her operations manager.
1. Apply 3 lot-sizing rules (FOQ, POQ and L4L) to the data given in the problem.
Estimate the holding cost
Estimate the ordering cost
Use EOQ to determine FOQ and POQ
Exhibit 1 BILL OF MATERIAL Source: A-CAT Corp. and case authors. Exhibit 2 PRODUCT STRUCTURE DIAGRAM Source: A-CAT Corp. and case authors. Exhibit 3 MASTER SCHEDULE Source: A-CAT Corp. and case authors. Exhibit 4 INVENTORY LEVELS OF COMPONENTS Source: A-CAT Corp. and case authors. Exhibit 5 COSTS ASSOCIATED Inventory carrying cost =0.5 per cent. Source: A-CAT Corp. and case authors. Exhibit 1 BILL OF MATERIAL Source: A-CAT Corp. and case authors. Exhibit 2 PRODUCT STRUCTURE DIAGRAM Source: A-CAT Corp. and case authors. Exhibit 3 MASTER SCHEDULE Source: A-CAT Corp. and case authors. Exhibit 4 INVENTORY LEVELS OF COMPONENTS Source: A-CAT Corp. and case authors. Exhibit 5 COSTS ASSOCIATED Inventory carrying cost =0.5 per cent. Source: A-CAT Corp. and case authors
Step by Step Solution
There are 3 Steps involved in it

Get step-by-step solutions from verified subject matter experts