

Question: solve the given question using the given excel template. post excel file and screeenshots of excel file as well Question 2: Analytical Hierarchy Process National
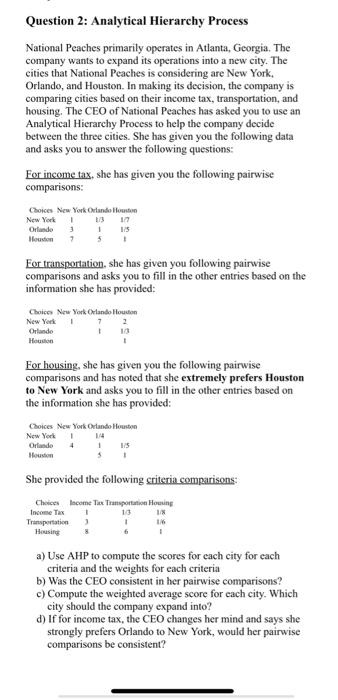
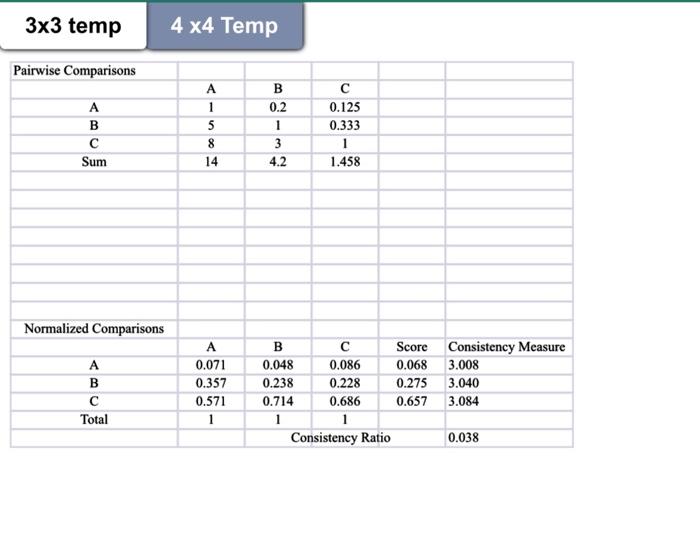
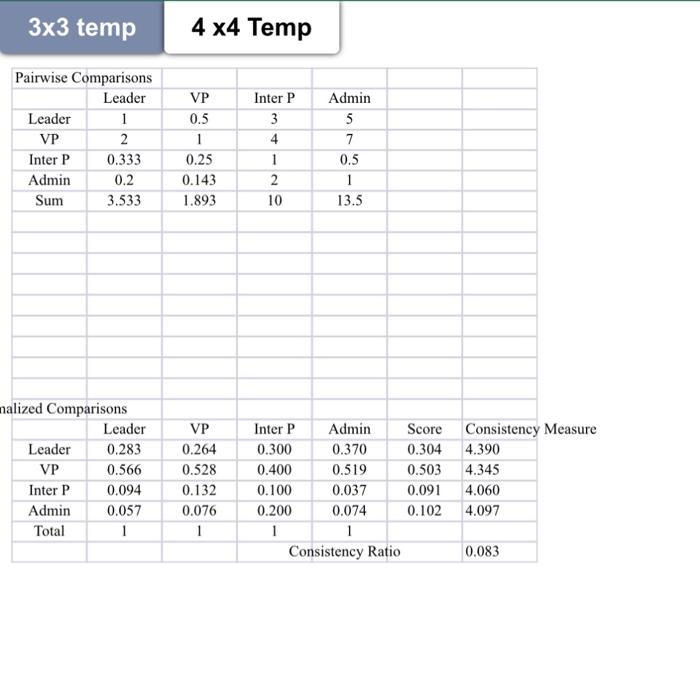
Question 2: Analytical Hierarchy Process National Peaches primarily operates in Atlanta, Georgia. The company wants to expand its operations into a new city. The cities that National Peaches is considering are New York, Orlando, and Houston. In making its decision, the company is comparing cities based on their income tax, transportation, and housing. The CEO of National Peaches has asked you to use an Analytical Hierarchy Process to help the company decide between the three cities. She has given you the following data and asks you to answer the following questions: For income tax, she has given you the following pairwise comparisons: Eor transportation, she has given you following pairwise comparisons and asks you to fill in the other entries based on the information she has provided: For housing, she has given you the following pairwise comparisons and has noted that she extremely prefers Houston to New York and asks you to fill in the other entries based on the information she has provided: She provided the following criteria comparisons: a) Use AHP to compute the scores for each city for each criteria and the weights for each criteria b) Was the CEO consistent in her pairwise comparisons? c) Compute the weighted average score for each city. Which city should the company expand into? d) If for income tax, the CEO changes her mind and says she strongly prefers Orlando to New York, would her pairwise comparisons be consistent? 33 temp 44 Temp \begin{tabular}{|c|c|c|c|c|c|c|} \hline Pairwise Comparisons & & & & \\ \hline & Leader & VP & Inter P & Admin & & \\ \hline Leader & 1 & 0.5 & 3 & 5 & & \\ \hline VP & 2 & 1 & 4 & 7 & & \\ \hline Inter P & 0.333 & 0.25 & 1 & 0.5 & & \\ \hline Admin & 0.2 & 0.143 & 2 & 1 & & \\ \hline Sum & 3.533 & 1.893 & 10 & 13.5 & & \\ \hline & & & & & & \\ \hline & & & & & & \\ \hline & & & & & & \\ \hline & & & & & & \\ \hline & & & & & & \\ \hline & & & & & & \\ \hline & & & & & & \\ \hline alized Comparisons & & & & & \\ \hline & Leader & VP & Inter P & Admin & Score & Consistency \\ \hline Leader & 0.283 & 0.264 & 0.300 & 0.370 & 0.304 & 4.390 \\ \hline VP & 0.566 & 0.528 & 0.400 & 0.519 & 0.503 & 4.345 \\ \hline Inter P & 0.094 & 0.132 & 0.100 & 0.037 & 0.091 & 4.060 \\ \hline Admin & 0.057 & 0.076 & 0.200 & 0.074 & 0.102 & 4.097 \\ \hline Total & 1 & 1 & 1 & 1 & & \\ \hline & & & & & & \\ \hline & & & & & \\ \hline \end{tabular} Question 2: Analytical Hierarchy Process National Peaches primarily operates in Atlanta, Georgia. The company wants to expand its operations into a new city. The cities that National Peaches is considering are New York, Orlando, and Houston. In making its decision, the company is comparing cities based on their income tax, transportation, and housing. The CEO of National Peaches has asked you to use an Analytical Hierarchy Process to help the company decide between the three cities. She has given you the following data and asks you to answer the following questions: For income tax, she has given you the following pairwise comparisons: Eor transportation, she has given you following pairwise comparisons and asks you to fill in the other entries based on the information she has provided: For housing, she has given you the following pairwise comparisons and has noted that she extremely prefers Houston to New York and asks you to fill in the other entries based on the information she has provided: She provided the following criteria comparisons: a) Use AHP to compute the scores for each city for each criteria and the weights for each criteria b) Was the CEO consistent in her pairwise comparisons? c) Compute the weighted average score for each city. Which city should the company expand into? d) If for income tax, the CEO changes her mind and says she strongly prefers Orlando to New York, would her pairwise comparisons be consistent? 33 temp 44 Temp \begin{tabular}{|c|c|c|c|c|c|c|} \hline Pairwise Comparisons & & & & \\ \hline & Leader & VP & Inter P & Admin & & \\ \hline Leader & 1 & 0.5 & 3 & 5 & & \\ \hline VP & 2 & 1 & 4 & 7 & & \\ \hline Inter P & 0.333 & 0.25 & 1 & 0.5 & & \\ \hline Admin & 0.2 & 0.143 & 2 & 1 & & \\ \hline Sum & 3.533 & 1.893 & 10 & 13.5 & & \\ \hline & & & & & & \\ \hline & & & & & & \\ \hline & & & & & & \\ \hline & & & & & & \\ \hline & & & & & & \\ \hline & & & & & & \\ \hline & & & & & & \\ \hline alized Comparisons & & & & & \\ \hline & Leader & VP & Inter P & Admin & Score & Consistency \\ \hline Leader & 0.283 & 0.264 & 0.300 & 0.370 & 0.304 & 4.390 \\ \hline VP & 0.566 & 0.528 & 0.400 & 0.519 & 0.503 & 4.345 \\ \hline Inter P & 0.094 & 0.132 & 0.100 & 0.037 & 0.091 & 4.060 \\ \hline Admin & 0.057 & 0.076 & 0.200 & 0.074 & 0.102 & 4.097 \\ \hline Total & 1 & 1 & 1 & 1 & & \\ \hline & & & & & & \\ \hline & & & & & \\ \hline \end{tabular}
Step by Step Solution
There are 3 Steps involved in it

Get step-by-step solutions from verified subject matter experts