

Question: Solve the problem above using R 1. Examine the warpbreaks data set which is built into R. This data set gives the number of warp
Solve the problem above using R
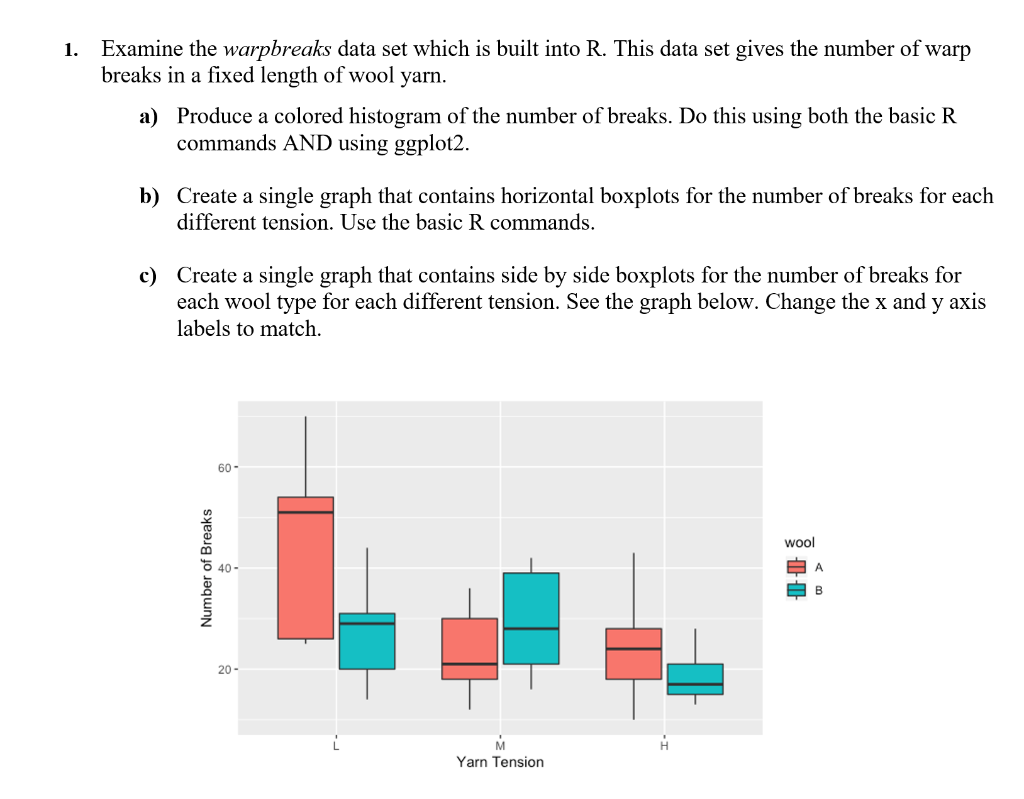
1. Examine the warpbreaks data set which is built into R. This data set gives the number of warp breaks in a fixed length of wool yarn. a) Produce a colored histogram of the number of breaks. Do this using both the basic R commands AND using ggplot2. b) Create a single graph that contains horizontal boxplots for the number of breaks for each different tension. Use the basic R commands. c) Create a single graph that contains side by side boxplots for the number of breaks for each wool type for each different tension. See the graph below. Change the x and y axis labels to match. 60 - Number of Breaks wool BA 40 - BB 20- Yarn Tension
Step by Step Solution
There are 3 Steps involved in it

Get step-by-step solutions from verified subject matter experts