

Question: solve the problem in the image 2 The Standard Normal Distribution represented by the function f (z) = E 9? is used extensively in Statistics
solve the problem in the image

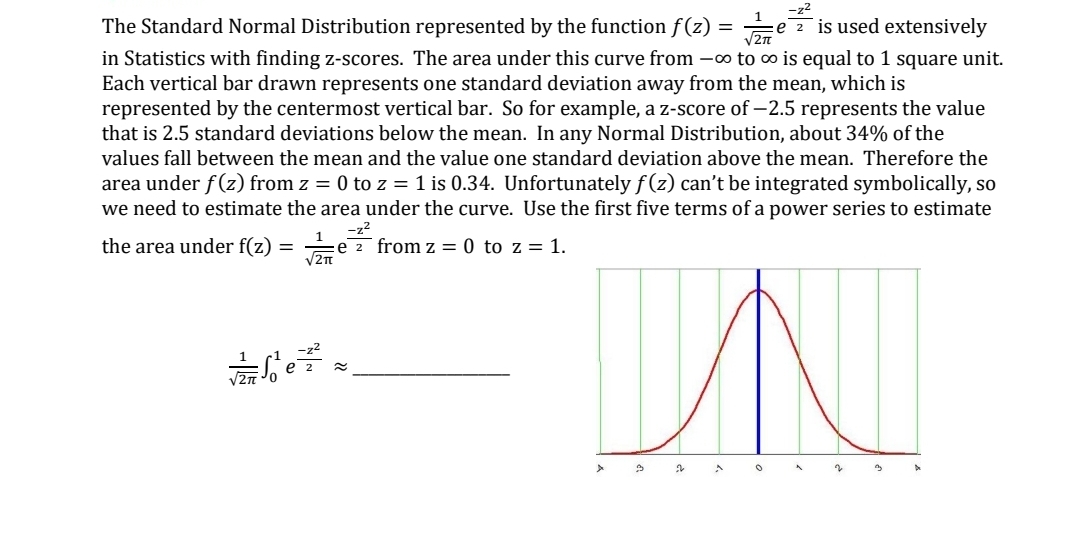
2 The Standard Normal Distribution represented by the function f (z) = E 9? is used extensively in Statistics with nding z-scores. The area under this curve from oo to on is equal to 1 square unit. Each vertical bar drawn represents one standard deviation away from the mean, which is represented by the centermost vertical bar. 50 for example, a z-score of 2.5 represents the value that is 2.5 standard deviations below the mean. In any Normal Distribution, about 34% of the values fall between the mean and the value one standard deviation above the mean. Therefore the area under f (z) from 2 = D to z = 1 is 0.34. Unfortunately f (2) can't be integrated symbolically, so we need to estimate the area gander the curve. Use the rst ve terms of a power series to estimate the area under f(z) = g? fromz = 0 to z = 1
Step by Step Solution
There are 3 Steps involved in it

Get step-by-step solutions from verified subject matter experts