

Question: Solve the problem without using EXCEL WORSHEET: The detailed calculation must appear in your ANSWER SHEETS. You can use the calculator. Limit your calculation within
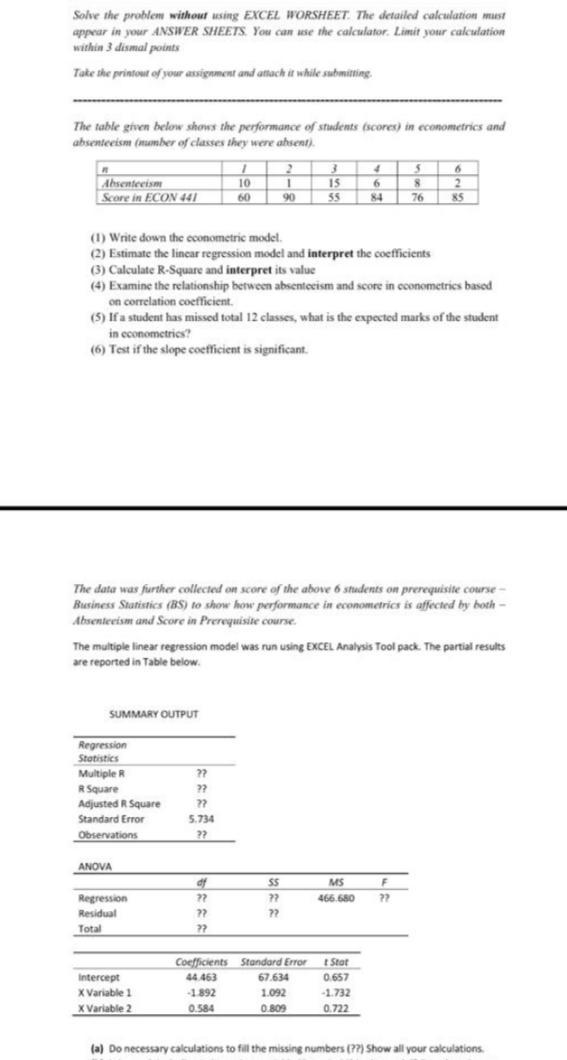
Solve the problem without using EXCEL WORSHEET: The detailed calculation must appear in your ANSWER SHEETS. You can use the calculator. Limit your calculation within 3 dismal points Take the printout of your assignment and attach it while submitting The table given below shows the performance of students scores) in econometrics and absenteeism number of classes they were ahsent) 1 S 6 Absenteeisme 10 1 15 8 Score in ECON 441 60 90 55 84 76 RS (1) Write down the cconometric model (2) Estimate the linear regression model and interpret the coefficients (3) Calculate R-Square and interpret its value (4) Examine the relationship between absenteeism and score in coonometrics based on correlation coefficient. (5) If a student has missed total 12 classes, what is the expected marks of the student in econometries? (6) Test if the slope coefficient is significant The data was further collected on score of the above 6 students on prerequisite course - Business Statistics (BS) to show how performance in econometrics is affected by both Absenteeism and Score in Prerequisite course. The multiple linear regression model was run using EXCEL Analysis Tool pack. The partial results are reported in Table below. SUMMARY OUTPUT Regression Statistics Multiple R Square Adjusted RSquare Standard Error Observations ?? ?? ?? 5.734 ?? ANOVA MS 466.680 SS 72 ?? F 22 Regression Residual Total df 27 72 ?? Intercept X Variable 1 X Variable 2 Coefficients Standard Error 44.463 67.634 -1892 1.092 0.584 0.809 Stor 0.657 -2.732 0.722 (a) Do necessary calculations to fill the missing numbers (?) Show all your calculations Solve the problem without using EXCEL WORSHEET: The detailed calculation must appear in your ANSWER SHEETS. You can use the calculator. Limit your calculation within 3 dismal points Take the printout of your assignment and attach it while submitting The table given below shows the performance of students scores) in econometrics and absenteeism number of classes they were ahsent) 1 S 6 Absenteeisme 10 1 15 8 Score in ECON 441 60 90 55 84 76 RS (1) Write down the cconometric model (2) Estimate the linear regression model and interpret the coefficients (3) Calculate R-Square and interpret its value (4) Examine the relationship between absenteeism and score in coonometrics based on correlation coefficient. (5) If a student has missed total 12 classes, what is the expected marks of the student in econometries? (6) Test if the slope coefficient is significant The data was further collected on score of the above 6 students on prerequisite course - Business Statistics (BS) to show how performance in econometrics is affected by both Absenteeism and Score in Prerequisite course. The multiple linear regression model was run using EXCEL Analysis Tool pack. The partial results are reported in Table below. SUMMARY OUTPUT Regression Statistics Multiple R Square Adjusted RSquare Standard Error Observations ?? ?? ?? 5.734 ?? ANOVA MS 466.680 SS 72 ?? F 22 Regression Residual Total df 27 72 ?? Intercept X Variable 1 X Variable 2 Coefficients Standard Error 44.463 67.634 -1892 1.092 0.584 0.809 Stor 0.657 -2.732 0.722 (a) Do necessary calculations to fill the missing numbers (?) Show all your calculations
Step by Step Solution
There are 3 Steps involved in it

Get step-by-step solutions from verified subject matter experts