

Question: Solve the question above through excel additional info: Use the following stock to sales ratios to plan monthly BOM and EOM stocks: Plan the January
Solve the question above through excel
additional info:
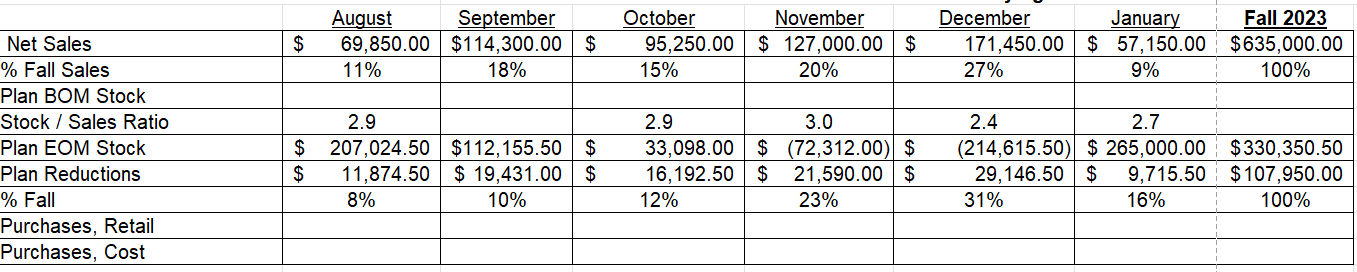
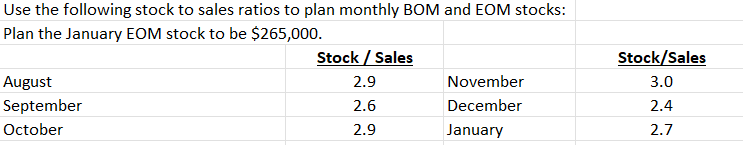
Use the following stock to sales ratios to plan monthly BOM and EOM stocks: Plan the January EOM stock to be $265,000. \begin{tabular}{l|c|l|c} & Stock / Sales & & Stock/Sales \\ \hline August & 2.9 & November & 3.0 \\ \hline September & 2.6 & December & 2.4 \\ \hline October & 2.9 & January & 2.7 \end{tabular} \begin{tabular}{|c|c|c|c|c|c|c|c|c|c|c|c|} \hline & \multicolumn{2}{|r|}{ August } & September & \multicolumn{2}{|c|}{ October } & \multicolumn{2}{|r|}{ November } & \multicolumn{2}{|c|}{ December } & January & \multirow{2}{*}{$635,000.00Fall2023} \\ \hline Net Sales & $ & 69,850.00 & $114,300.00 & $ & 95,250.00 & $ & 127,000.00 & $ & 171,450.00 & $57,150.00 & \\ \hline% Fall Sales & & 11% & 18% & & 15% & & 20% & & 27% & 9% & 100% \\ \hline \multicolumn{12}{|l|}{ Plan BOM Stock } \\ \hline Stock / Sales Ratio & & 2.9 & & & 2.9 & & 3.0 & & 2.4 & 2.7 & \\ \hline Plan EOM Stock & $ & 207,024.50 & $112,155.50 & $ & 33,098.00 & $ & (72,312.00) & $ & (214,615.50) & $265,000.00 & $330,350.50 \\ \hline Plan Reductions & $ & 11,874.50 & $19,431.00 & $ & 16,192.50 & $ & 21,590.00 & $ & 29,146.50 & 9,715.50 & $107,950.00 \\ \hline% Fall & & 8% & 10% & & 12% & & 23% & & 31% & 16% & 100% \\ \hline \multicolumn{12}{|l|}{ Purchases, Retail } \\ \hline Purchases, Cost & & & & & & & & & & & \\ \hline \end{tabular} Use the following stock to sales ratios to plan monthly BOM and EOM stocks: Plan the January EOM stock to be $265,000. \begin{tabular}{l|c|l|c} & Stock / Sales & & Stock/Sales \\ \hline August & 2.9 & November & 3.0 \\ \hline September & 2.6 & December & 2.4 \\ \hline October & 2.9 & January & 2.7 \end{tabular} \begin{tabular}{|c|c|c|c|c|c|c|c|c|c|c|c|} \hline & \multicolumn{2}{|r|}{ August } & September & \multicolumn{2}{|c|}{ October } & \multicolumn{2}{|r|}{ November } & \multicolumn{2}{|c|}{ December } & January & \multirow{2}{*}{$635,000.00Fall2023} \\ \hline Net Sales & $ & 69,850.00 & $114,300.00 & $ & 95,250.00 & $ & 127,000.00 & $ & 171,450.00 & $57,150.00 & \\ \hline% Fall Sales & & 11% & 18% & & 15% & & 20% & & 27% & 9% & 100% \\ \hline \multicolumn{12}{|l|}{ Plan BOM Stock } \\ \hline Stock / Sales Ratio & & 2.9 & & & 2.9 & & 3.0 & & 2.4 & 2.7 & \\ \hline Plan EOM Stock & $ & 207,024.50 & $112,155.50 & $ & 33,098.00 & $ & (72,312.00) & $ & (214,615.50) & $265,000.00 & $330,350.50 \\ \hline Plan Reductions & $ & 11,874.50 & $19,431.00 & $ & 16,192.50 & $ & 21,590.00 & $ & 29,146.50 & 9,715.50 & $107,950.00 \\ \hline% Fall & & 8% & 10% & & 12% & & 23% & & 31% & 16% & 100% \\ \hline \multicolumn{12}{|l|}{ Purchases, Retail } \\ \hline Purchases, Cost & & & & & & & & & & & \\ \hline \end{tabular}
Step by Step Solution
There are 3 Steps involved in it

Get step-by-step solutions from verified subject matter experts