

Question: solve the question by providing working steps Items Total Unit Sold (Units) Price per unit (RM) Total Fixed Cost (RM) Total Variable Cost (RM) Targeted
solve the question by providing working steps 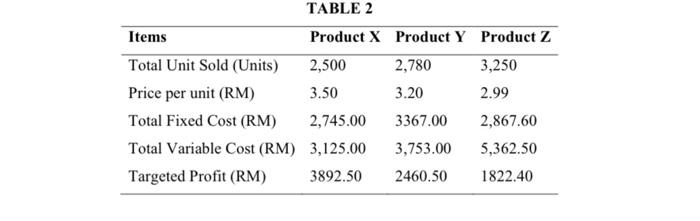
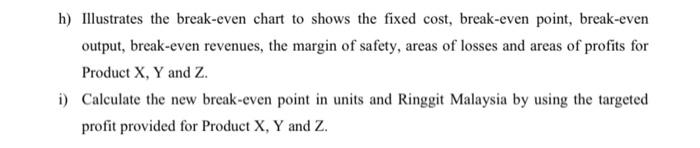
Items Total Unit Sold (Units) Price per unit (RM) Total Fixed Cost (RM) Total Variable Cost (RM) Targeted Profit (RM) TABLE 2 Product X Product Y Product Z 2,500 2,780 3,250 3.50 3.20 2.99 2,745.00 3367.00 2,867.60 3,125.00 3,753.00 5,362.50 3892.50 2460.50 1822.40 h) Illustrates the break-even chart to shows the fixed cost, break-even point, break-even output, break-even revenues, the margin of safety, areas of losses and areas of profits for Product X, Y and Z. i) Calculate the new break-even point in units and Ringgit Malaysia by using the targeted profit provided for Product X, Y and Z
Step by Step Solution
There are 3 Steps involved in it
1 Expert Approved Answer
Step: 1 Unlock

Question Has Been Solved by an Expert!
Get step-by-step solutions from verified subject matter experts
Step: 2 Unlock
Step: 3 Unlock