

Question: Solve the questions below. 1} a} Graph: Add to the below graph a new line depicting a sudden decrease in Aggregate Demand, e.g. because of
Solve the questions below.
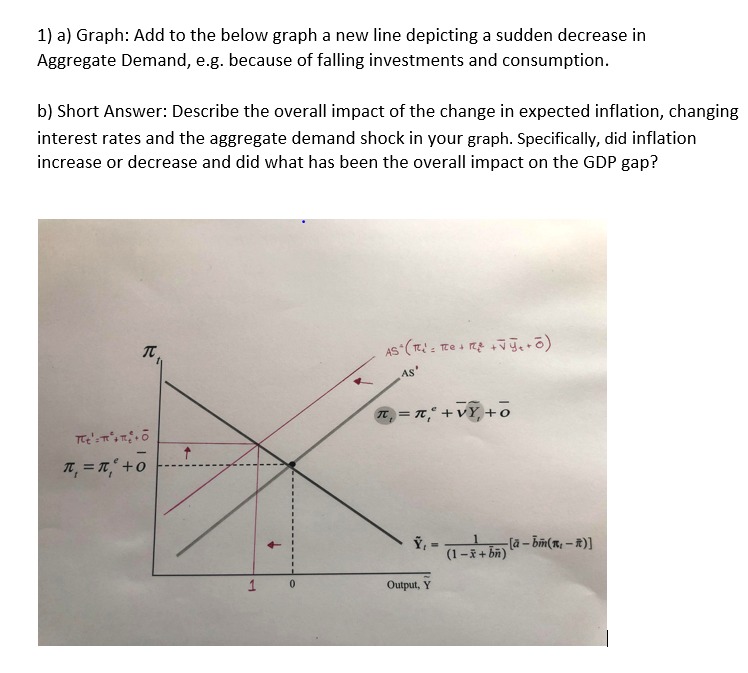
1} a} Graph: Add to the below graph a new line depicting a sudden decrease in Aggregate Demand, e.g. because of falling investments and consumption. b} Short Answer: Describe the overall impact of the change in expected ination, changing interest rates and the aggregate demand shock in your graph. Specically, did ination increase or decrease and did what has been the overall impact on the GDP gap? {i} Briefly explain, with the aid of a diagram, how a central bank con ducts. a corrtractio nary open market operation in the money market, making clear the implications of the operation for the price of Treasury bills and the short term rate of interest. [6] [ii] Write down the equation for the money multiplier that shows the link between the narrow money supply and the broad money supply. Your equation must include the following variables and notation; c forthe proportion of deposits held by the public as. cash and r for the proportion of deposits held by the banks as cash. [2] {iii} If the narrow money supply rises. by 9 per cent and the money multiplier is 3 then by what percentage does the broad money supply rise? [2]
Step by Step Solution
There are 3 Steps involved in it

Get step-by-step solutions from verified subject matter experts