

Question: Solve The speed of a falling object increases at a constant rate as time increases since the object was dropped. Which graph could represent the
Solve
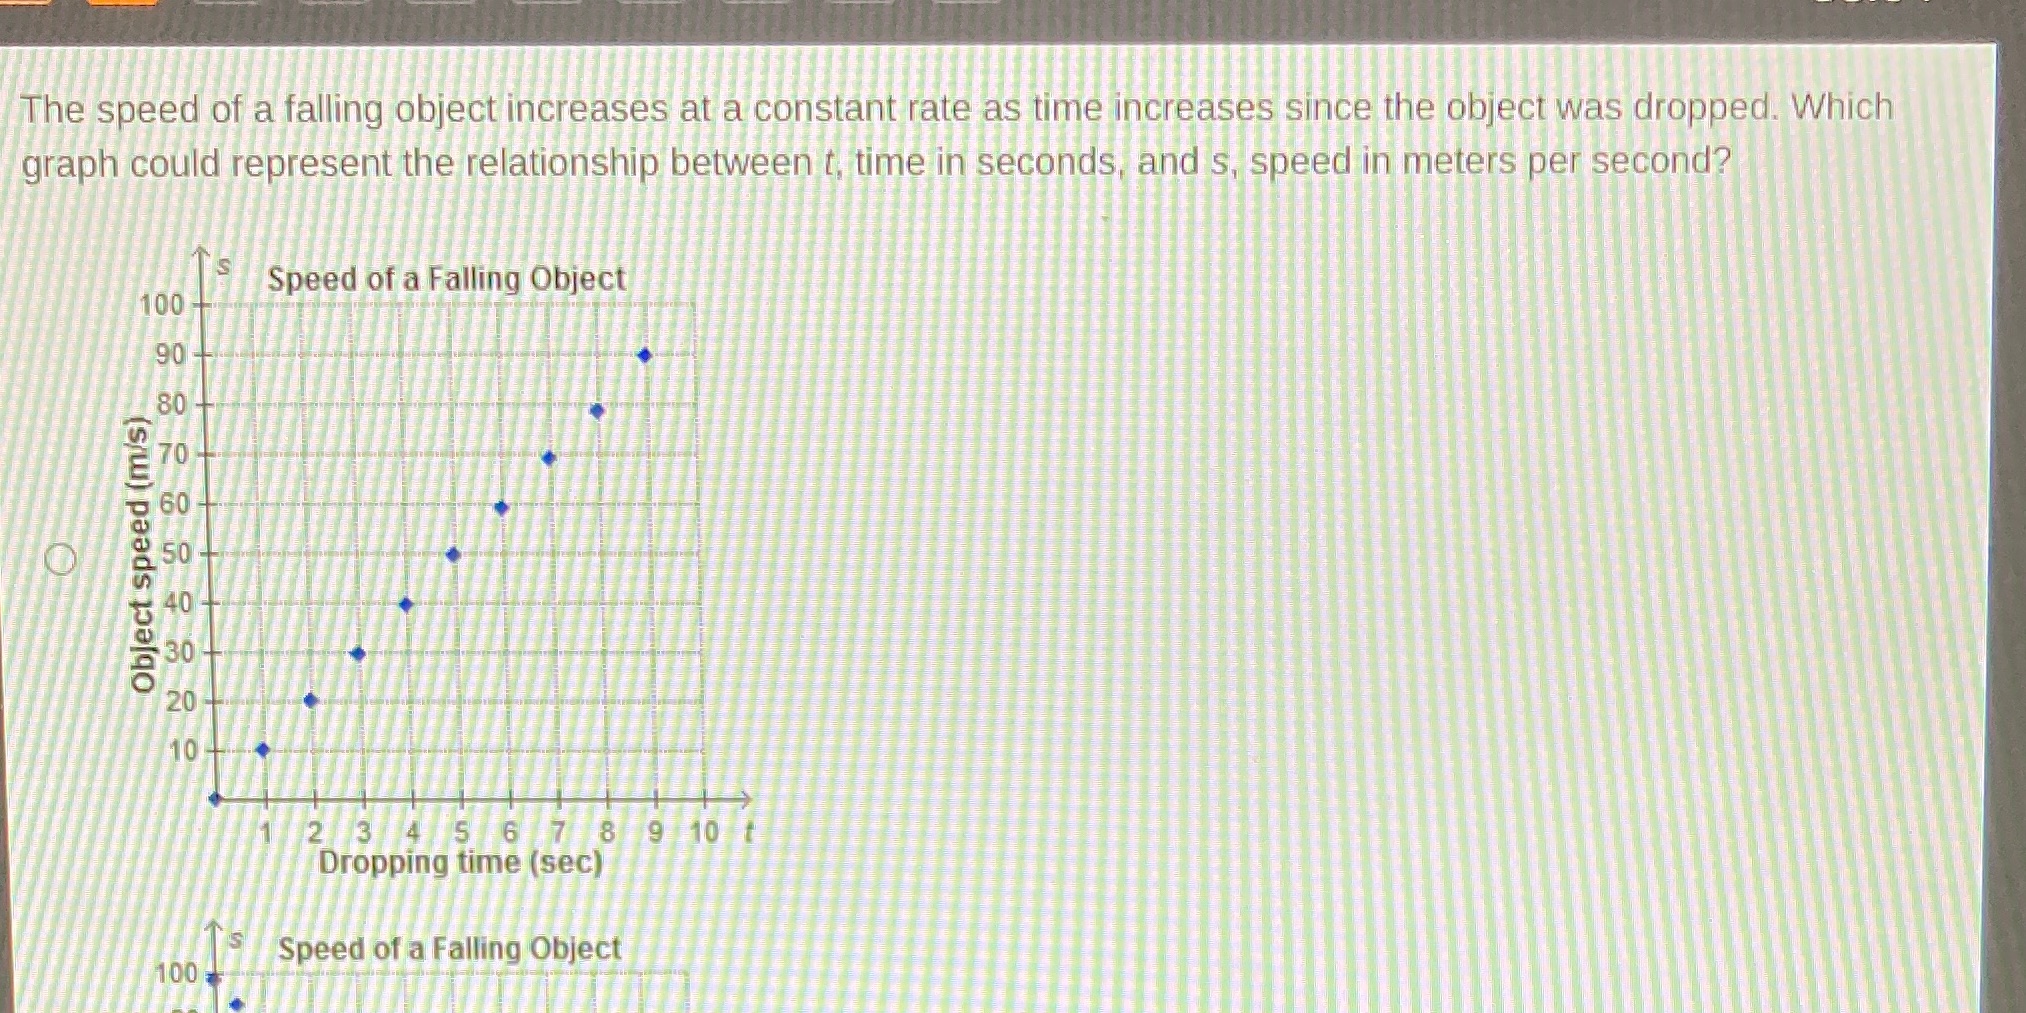
The speed of a falling object increases at a constant rate as time increases since the object was dropped. Which graph could represent the relationship between t, time in seconds, and s, speed in meters per second? S Speed of a Falling Object 100 90 80 Object speed (m/s) 10 2 3 4 5 6 7 8 9 10 1 Dropping time (sec) S Speed of a Falling Object 100
Step by Step Solution
There are 3 Steps involved in it
1 Expert Approved Answer
Step: 1 Unlock

Question Has Been Solved by an Expert!
Get step-by-step solutions from verified subject matter experts
Step: 2 Unlock
Step: 3 Unlock